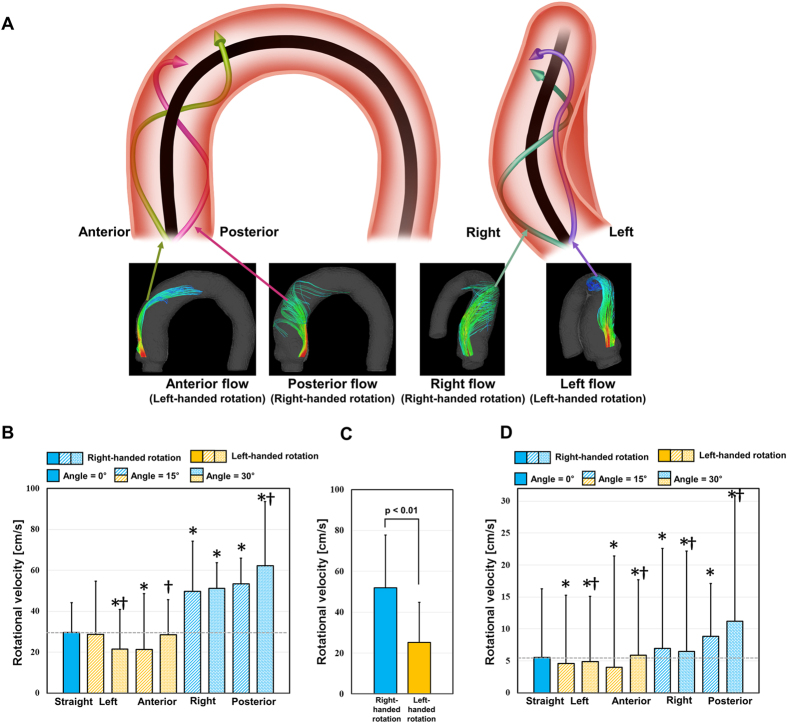
Figure 3. Helical rotations of various aortic valve flows.
(A) Development of rotational flows in the ascending aorta, (B) rotational velocity in the ascending aorta, (C) comparison of rotational velocity in the ascending aorta depending on the helical rotation directions, and (D) average rotational velocity of the whole aortic flow. Note that the black solid line in (A) is the centerline axis of the thoracic aorta. *Statistical difference (p < 0.01, Bonferroni corrected) in comparison with the rotational velocity of straight aortic valve flow. †Statistical difference (p < 0.01, Bonferroni corrected) in comparison with the rotational velocity in the same aortic flow direction, but at 15°. The error bar indicates the mean + SD. Only positive errors are shown for clarity.

