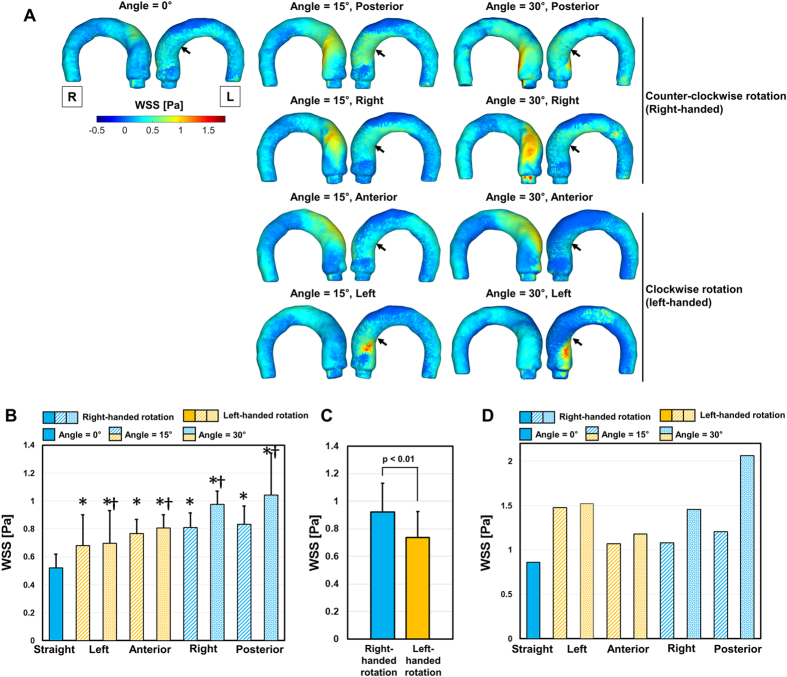
Figure 5. Effect of the aortic flow direction and angle on WSS in the thoracic aorta.
(A) Colormap of WSS, (B) comparison with the top 5% percentile of WSS, (C) comparison with the top 5% percentile of WSS depending on the rotational direction, and (D) comparison of the maximum WSS at the thoracic aorta. The black arrows in (A) indicate the region of WSS in the ascending aorta. *Statistical difference (p < 0.01, Bonferroni corrected) in comparison with WSS at straight aortic valve flow. †Statistical difference (p < 0.01, Bonferroni corrected) in comparison with WSS in the same aortic flow direction, but at 15°. The error bar indicates mean + SD. Only the positive error is shown for clarity. L and R indicate left and right, respectively.

