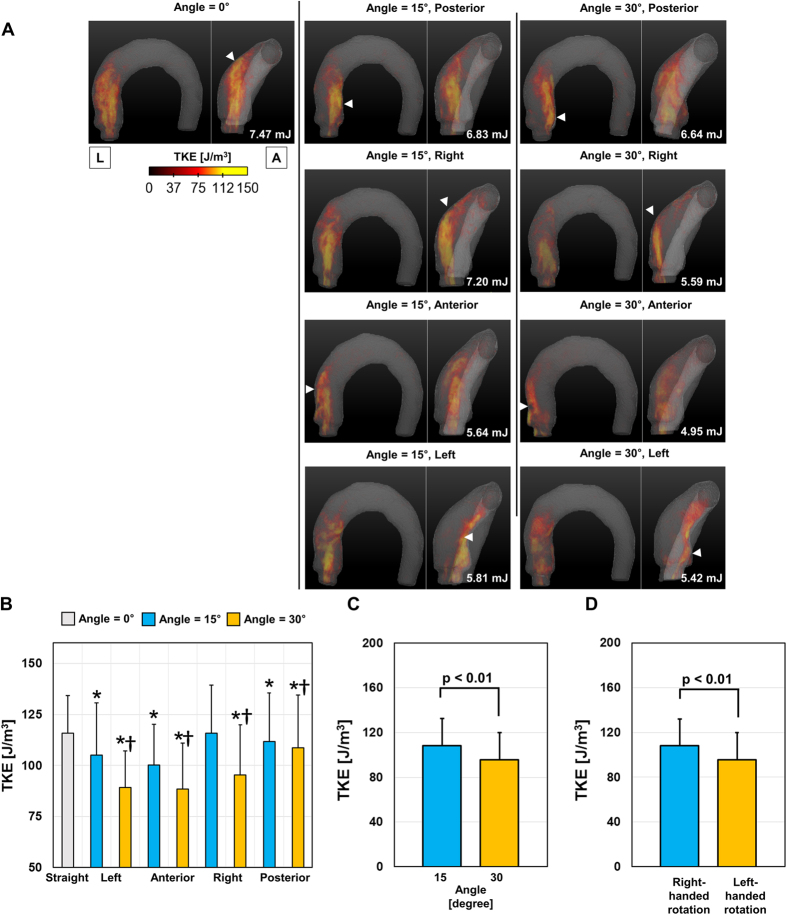
Figure 8. Effect of the aortic valve direction and angle on TKE distribution.
(A) Volume-rendering of TKE in the thoracic aorta, (B) comparison with the top 5% percentile of TKE, (C) effect of the aortic valve angle, and (D) effect of helical rotation. *Statistical difference (p < 0.01, Bonferroni corrected) in comparison with TKE at the straight aortic valve flow. †Statistical difference (p < 0.01, Bonferroni corrected) in comparison with TKE at the same aortic flow direction, but at 15°. The error bar indicates the mean + SD. Only the positive error is shown for clarity.

