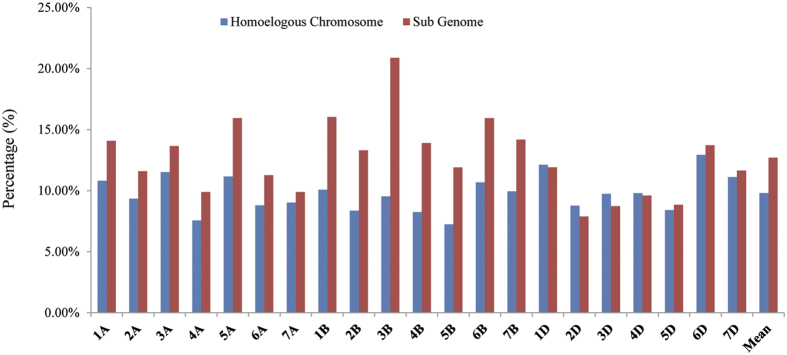
Figure 5. Different average amplification rates between wheat homoeologous chromosomes and its sub genome revealed by newly developed SSR markers.
Note: all the developed genome-wide microsatellite markers derived from each chromosome were separately searched against the assembled genomic sequences of wheat with in silico PCR. The average amplification rate for homoeologous chromosomes and its sub genome chromosomes were separately calculated for each chromosome. For example, in wheat 1A chromosome, the average amplification rate for homoeologous chromosomes were defined as mean amplification rate in 2A to 7A, while 1B and 1D for its sub genome chromosomes.

