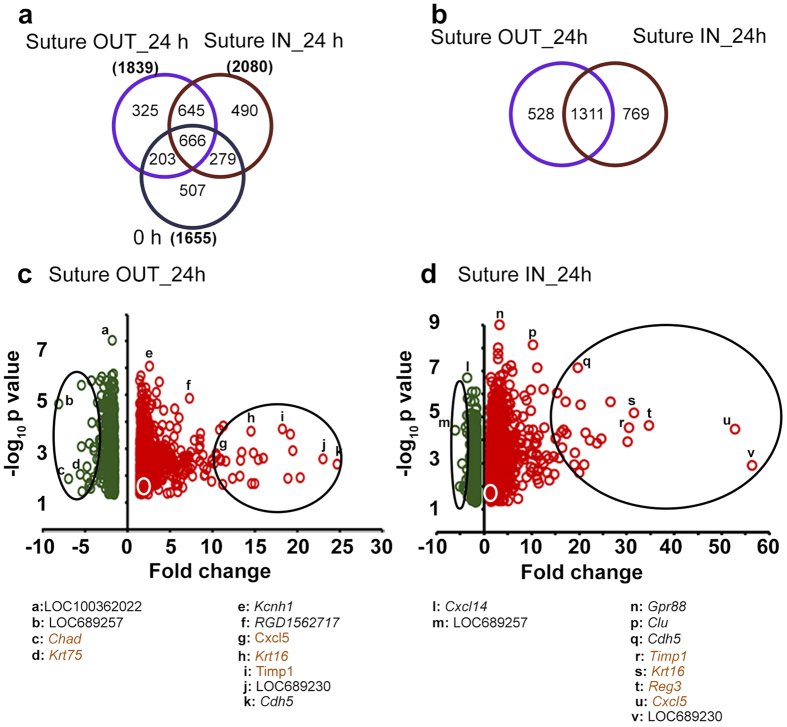
Figure 3. Differentially expressed genes (DEG) at 24 h suture IN and suture OUT.
(a) Comparison of DEG at 0 h and 24 h. 0 h defines the starting point for the two arms. (b) Comparison of DEG between suture OUT and suture IN at 24 h only. (c) Volcano plot of the DEG in suture OUT and (d) Volcano plot of DEG in suture IN. In (c,d) the green and red colours represent down- and upregulated genes respectively and the white circles give the approximate location of Vegfa. Large black ovals highlight approximately the top 25 most up and 25 most down regulated genes. Specific genes are listed below. Those with significantly different FC between suture IN and OUT (p < 0.05) are highlighted in brown colour.

