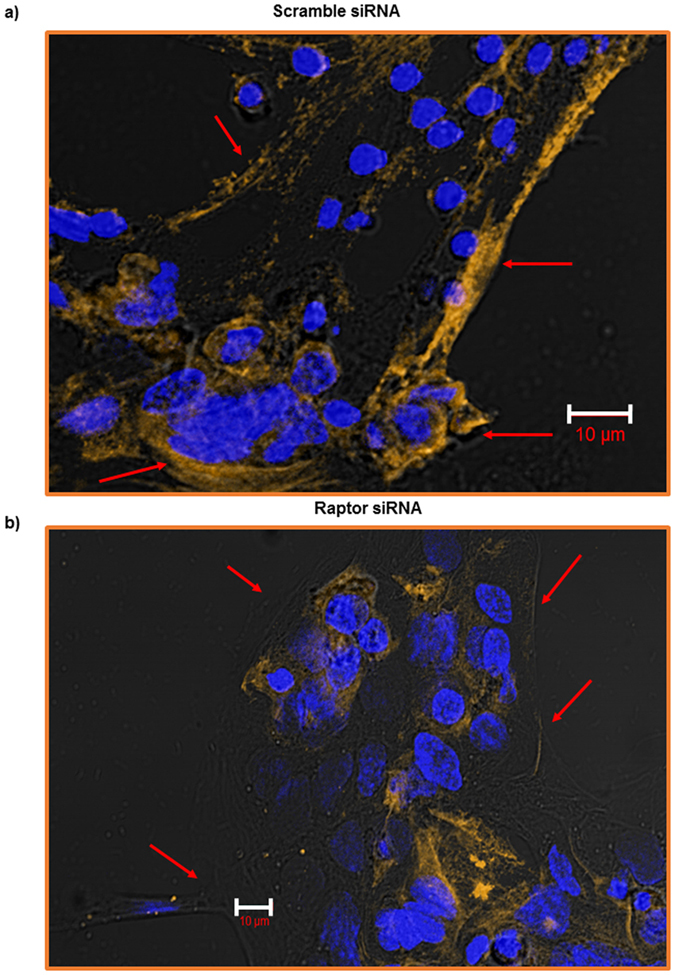
Figure 7. Cellular localization of RFC protein expression in PHT cells with mTORC1 inhibition.

Trophoblast cells were transfected at 18 h in culture with scramble (a) or raptor (b) siRNA. At 90 h in culture, cells were fixed and RFC expression (yellow) was visualized using immunofluorescence. The data are from a representative experiment, and similar results were obtained from two other experiments. Nuclei were counterstained using DAPI (4′,6-diamidino-2-phenylindole) (blue). Scale bars represent 10 μm.
