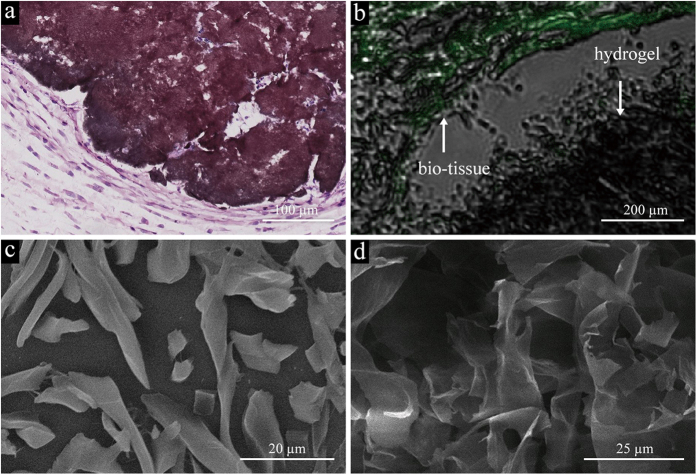
Figure 3.
(a) HE staining microscopy images of GPH2 four weeks after subcutaneous injection. A small amount of inflammatory response is shown around the graphene oxide. (b) CLSM images of GPH2 four weeks after subcutaneous injection. The inset shows the clear border of the tissues and GPH2. (c) SEM images of GPH2 compounds in vivo after subcutaneous injection for four weeks. (d) SEM image of pure GPH2.

