Figure 4.
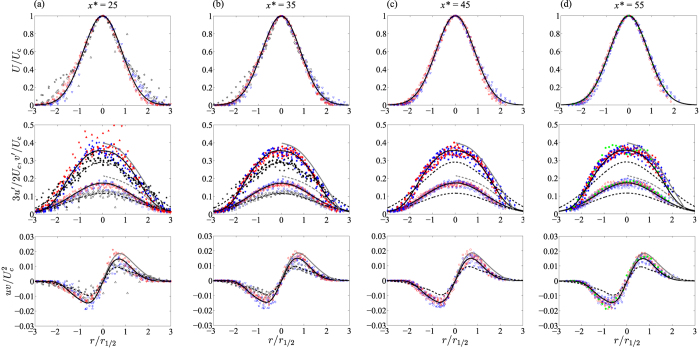
Self-similar radial profiles of ensemble-averaged normalised turbulence statistics at (a) x* = 25, (b) x* = 35, (c) x* = 45 and (d) x* = 55 showing (top) mean streamwise velocity with a Gaussian fit of the form: exp(−r/r1/2)2 ln(2), (middle) streamwise turbulence intensity (closed symbols) with least-squares spline fits to guide the eye, and radial turbulence intensity (open symbols) with Gaussian fits of the form: 0.174 exp(−0.4r/r1/2)2 ln(2) at Re = 135 (black symbols), and 0.117 exp(−0.33r/r1/2)2 ln(2) at Re = 260 (red symbols) and at Re = 400 (blue symbols), and (bottom) Reynolds shear stress with least-squares spline fits to guide the eye; 10 kV (Δ), 11 kV (∇), 12 kV (), 13 kV (☆), 14 kV (◻), 15 kV (◇), 16 kV (○); helium round jet turbulence data (Re = 7000, Fr = 643) from Amielh et al.24 (grey solid and dashed lines). For further comparison, the green closed circles in (d) are helium jet flow without plasma at x* = 70: Re = 400 and Fr = 38,800.

