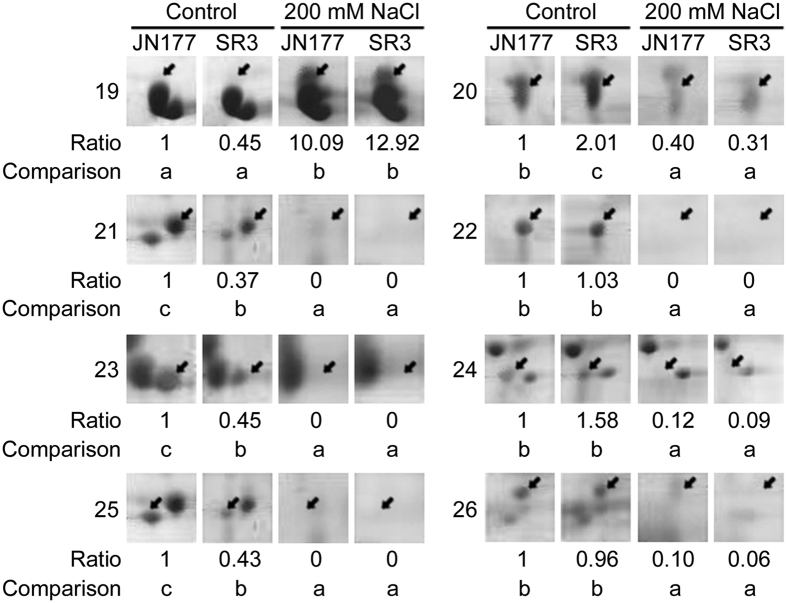
Figure 5. The spots of stress-responsive differential expressed proteins.
The spots indicated by arrows are differential expressed proteins. Numbers at the left side of spot panels are the spots labeled in Fig. 3A and Supplementary Figure S1. Ratios below the spot panels are the relative grey values of spots with the grey values of JN177 under the control condition as the reference. The spots between two samples marked without different letters indicate no difference in means using the one-way ANOVA LSD analysis (P < 0.05).

