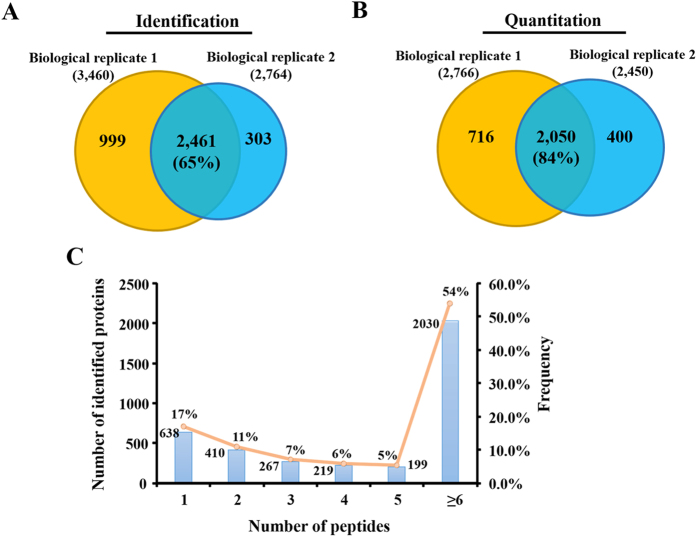
Figure 2. Overview of identified and quantified proteins.
Veen diagram representing the overlap of identified (A) and quantified (B) proteins in two biological replicates, respectively. The number in brackets indicates the percentage of common identified proteins. (C) Histogram displaying the number of peptides matched to proteins. The x-axis illustrates the number of identified peptides. The primary y-axis indicates the number of identified proteins (bars). The second y-axis represents the percent (lines).

