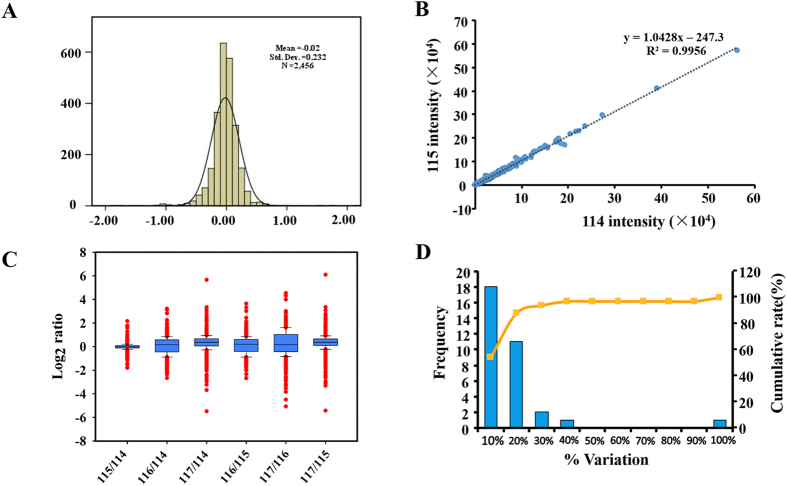
Figure 4. Evaluation of iTRAQ quantification proteomic experiments and determination of the cutoff value for differentially expressed proteins.
(A) Histogram distribution of quantified proteins log-transformed ratio between technical replicates fits a normal distribution with a standard deviation of 0.16. (B) Scatter plots of the two technical replicates, iTRAQ 116,117-labeled cytoplasm abnormal MII oocytes. (C) Box-plots analysis of ratios of peptides tagged with 4 tags from 4-plex kit and mixed with an equal amount of non-labeled peptides. Ratios were calculated relative to 114, 115 and 116 iTRAQ tag, respectively. (D) The percent variations for the common quantified proteins from two technical replicates. The primary vertical axis represents the number of proteins (bars), and the horizontal axis defines % variation. The secondary vertical axis represents cumulative % of the counted proteins (line).

