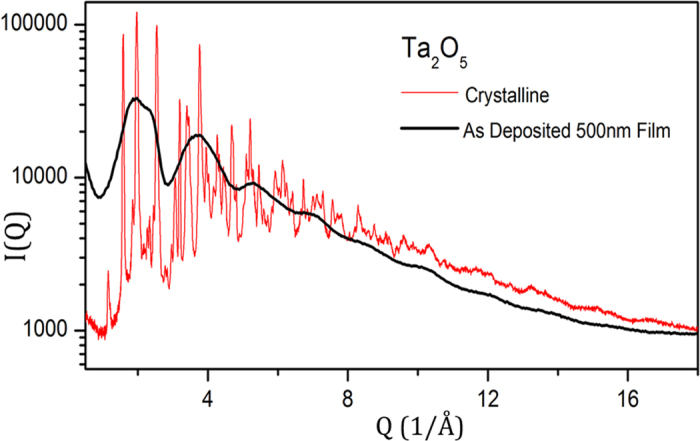
Figure 1. X-ray total scattering data for crystalline (in red) and an amorphous Ta2O5 thin film (in black).

The scattering data from the amorphous film was multiplied by a scale factor to facilitate comparison of the two data sets.

The scattering data from the amorphous film was multiplied by a scale factor to facilitate comparison of the two data sets.