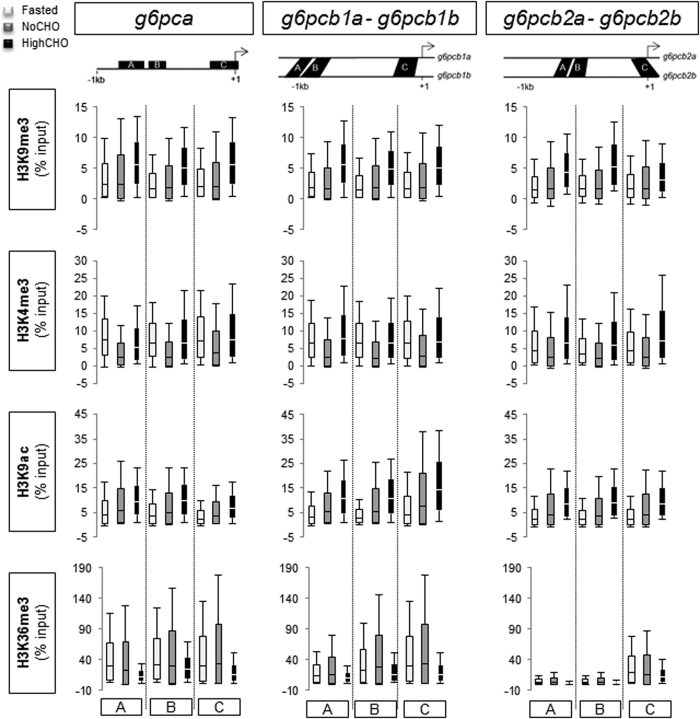
Figure 2. Histone modifications at g6pc gene loci in fasted trout (white), and those fed the NoCHO (grey) or the HighCHO (black) diet.
The bottom and top of the box are mean-SD and mean + SD respectively, and the band inside the box is the mean. The ends of the whiskers represent the minimum and maximum of the data. Data represent the averages of three independent experiments. Analysed regions are identified with upper case letters and located with respect to transcription star site (identified by broken arrow).

