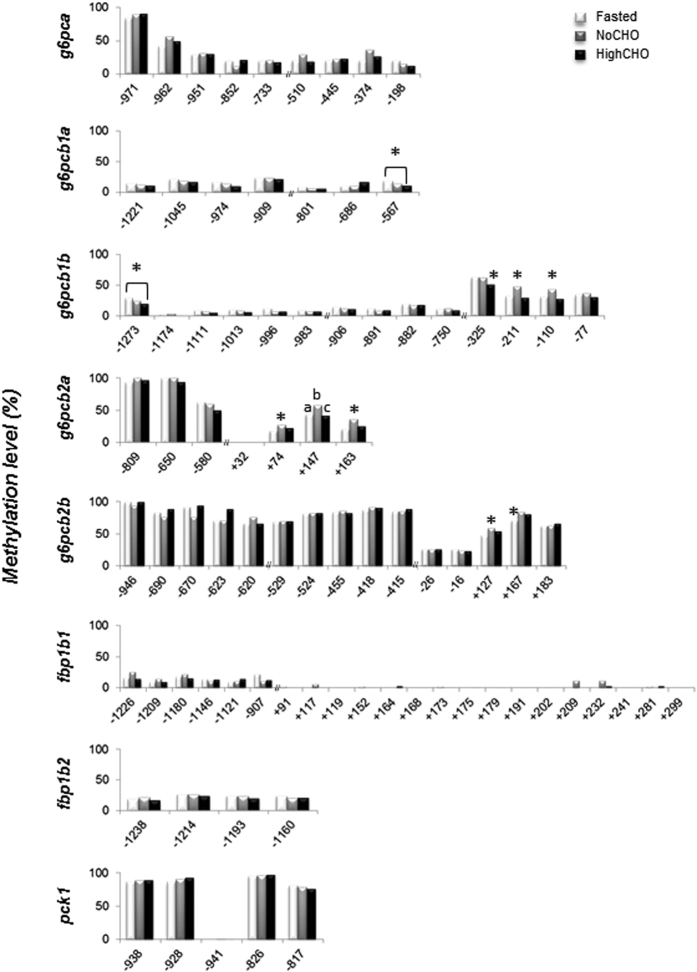
Figure 4. DNA methylation status of gluconeogenic genes in fasted trout (white bars), and those fed the NoCHO (grey bars) or the HighCHO (black bars) diet.
Data are expressed as percentage of methylation at each CpG site. Positions of CpG sites are given in relation to the transcription start site. Different letters and stars indicate significant differences between conditions (p < 0.01).

