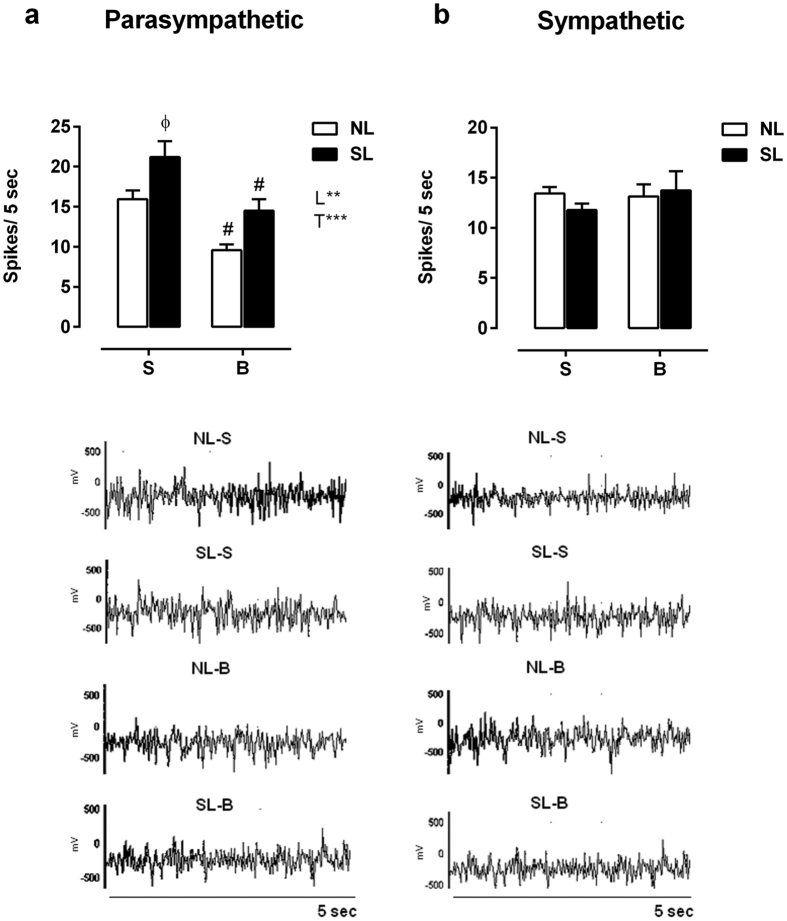
Figure 5.
Parasympathetic (a) and sympathetic (b) electrical nerve activity. Data are expressed as the mean ± SEM of 15–17 rats from each experimental group. Lower panel graphs are representative records of nerve discharges of each group. NL-S, normal litter rats treated with saline solution; SL-S, small litter rats treated with saline solution; NL-B, normal litter rats treated with scopolamine butylbromide; SL-B, small litter rats treated with scopolamine butylbromide. L, litter size factor; and T, treatment factor. **P < 0.01, ***P < 0.001, based on a two-way analysis of variance. ɸP < 0.05, statistical significance of the differences between NL and SL; #P < 0.05, statistical significance of saline versus scopolamine butylbromide animals, based on the Tukey multiple comparisons test.

