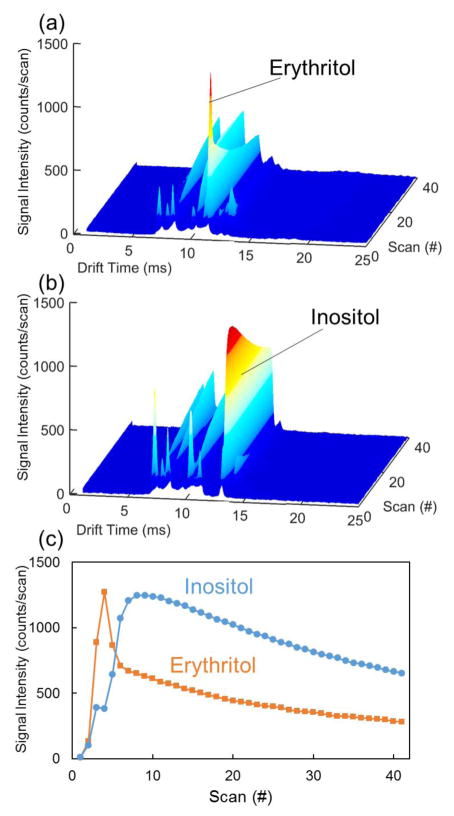
Figure 3.
Representative IMS spectra for (a) erythritol and (b) inositol displaying signal as a function of drift time and scan number. (c) represents the signal intensity at the drift times for erythritol and inositol as a function of scan number for the IMS spectra in (a) and (b). Measurements were taken for base case instrument parameters. Relative signal intensity increases from dark blue to red color.

