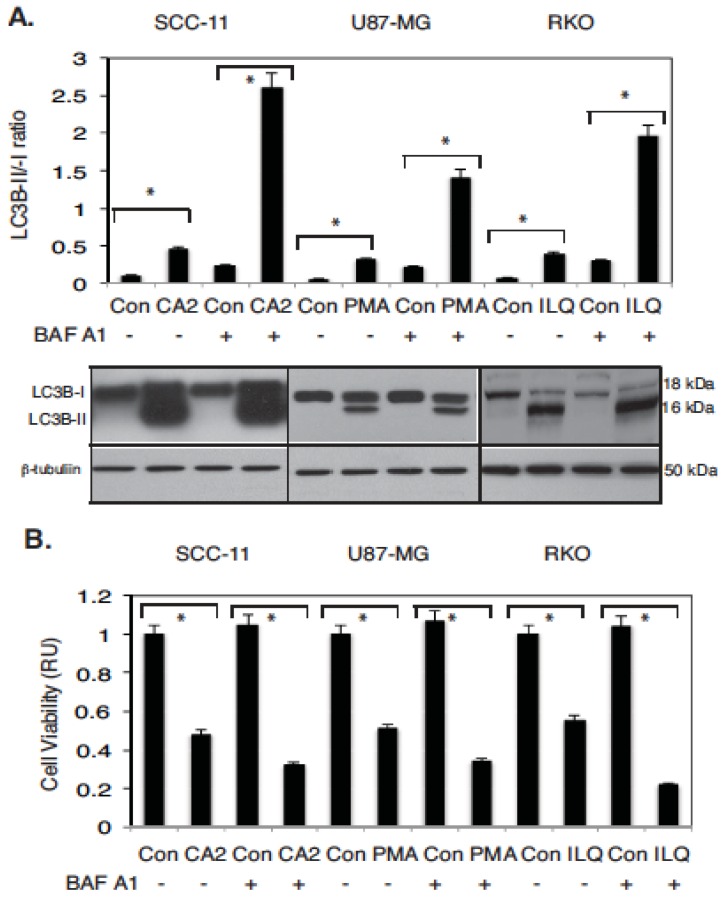
Figure 3.
Selected marine drugs induced autophagic flux and inhibit cell viability in tumor cells. Tested tumor cells were treated with control media (Con), or chromomycin A2 (CA2, 30 nM), psammaplin A (PMA, 7.5 µM) and ilimaquinone (ILQ, 10 µM) for 48 h. Additionally, the 100 nM of bafilomycin A1 (BAF A1, #B1793, Sigma) was added to cells for 12 h, as indicated by (+). (A) Protein levels for LC3B-I, -II, normalized by the β-tubulin level (loading control) were examined using immunoblotting (representative immunoblots shown). Immunoblots were scanned using PhosphorImager (Molecular Dynamics) and quantified by ImageQuant software version 3.3 (Molecular Dynamics). Values of LC3B-II were expressed as a portion of LC3B-I values defined as 1. The LC3B-II/LC3B-I ratios were plotted as bars using the Microsoft Excel software with standard deviations (± SD) resulting from three independent experiments and three individual measurements of each experiment (* p < 0.05, t-test); (B) Cell viability assay. 104 cells/well in 96-well plates were incubated in serum-free medium with 5 μg/mL of 3-(4,5-dimethyl thiazol-2-yl)-2,5-diphenyl tetrazolium bromide (American Tissue Culture Collection) in the dark for 4 h at 37 °C. Cells were lysed and incubated for 2 h at 37 °C, and the measurements (A570nm to A650nm) were obtained on a Spectra Max-250 plate reader (Molecular Devices), as described in reference 44. Each assay was repeated three times in triplicate. Diagrams indicated the extent of cell viability expressed as a portion of the control represented as 1. Bars are the mean ± SD of triplicate (* p < 0.05, t-test).

