FIG 5.
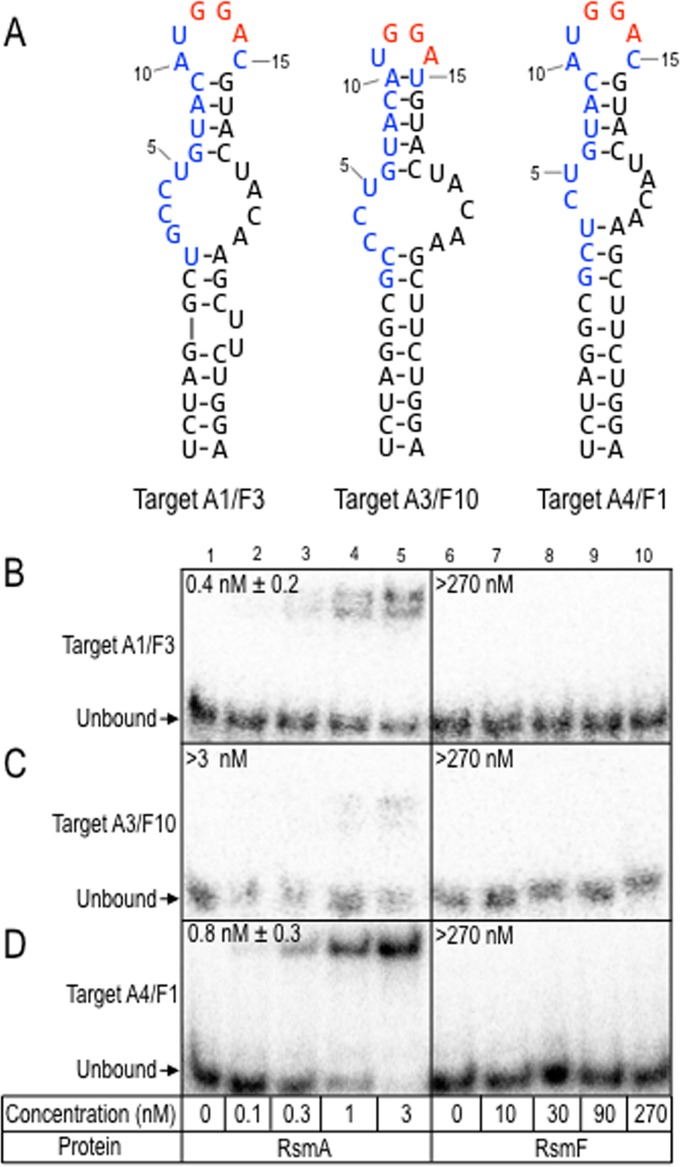
RsmA and RsmF binding to targets that were ≤96 nt. (A) Predicted secondary structures for targets A1/F3, A3/F10, and A4/F1, selected by RsmA and RsmF in round 6. Each target was in the top 10 list for RsmA and RsmF as indicated by the numeric designations. (B to D) Target RNAs were radiolabeled and incubated with the indicated concentrations of RsmA and RsmF for 30 min. Samples were analyzed by native gel electrophoresis and phosphorimaging. The positions of the unbound probes are indicated, and the apparent equilibrium binding constant is indicated in each panel.

