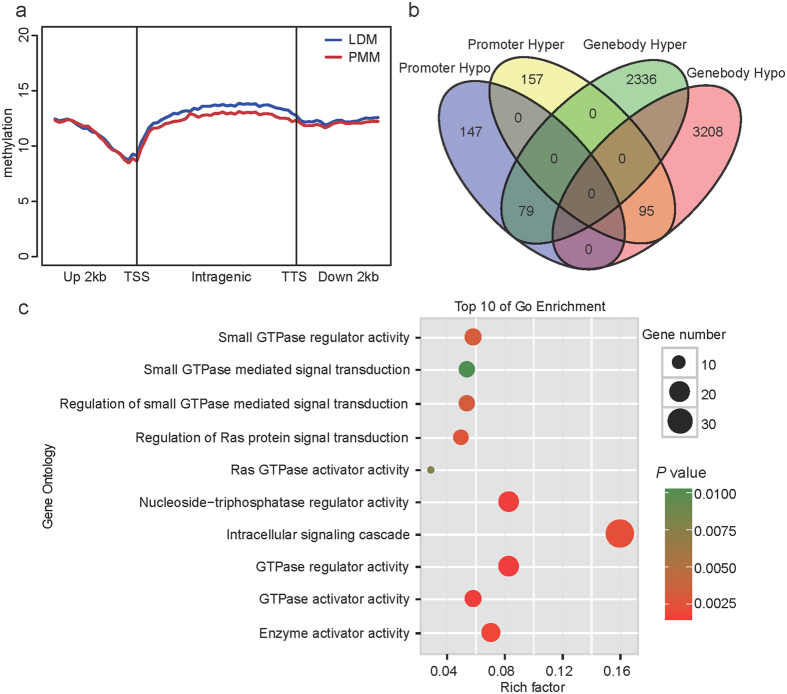
Figure 4. Genome-wide distribution of DMRs and function enrichment analysis.
(a) Distribution of MeDIP-Seq reads in the gene region. The x axis indicates the position around the gene element, and the y axis indicates the normalized read number. (b) Venn diagram of the numbers of DMRs located in the promoters and gene bodies. (c) Gene Ontology (GO) categories enriched for DMRs located in the promoter regions; the top 10 GO terms are listed. The P values were calculated using Benjamini-corrected modified Fisher’s exact test.

