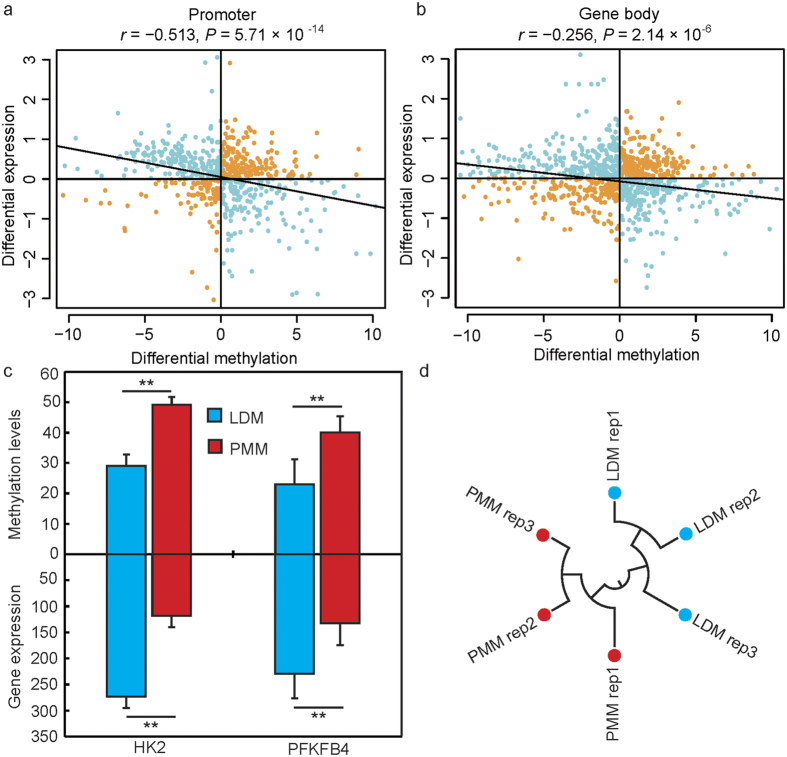
Figure 5. Correlation of gene expression levels with methylation profiles.
Pearson’s correlation of the methylation levels of the promoter (a) and gene body regions (b) and mRNA expression. (c) The different methylation status and mRNA expression levels of genes related to glycolysis. HK2: Hexokinases 2; PFKFB4: 6-phosphofructo-2-kinase/fructose-2, 6-bisphosphatase 4; ** statistical significance at P < 0.01. (d) Hierarchical clustering of samples by using differentially expression genes for biological reproducibility analysis.

