Figure 1.
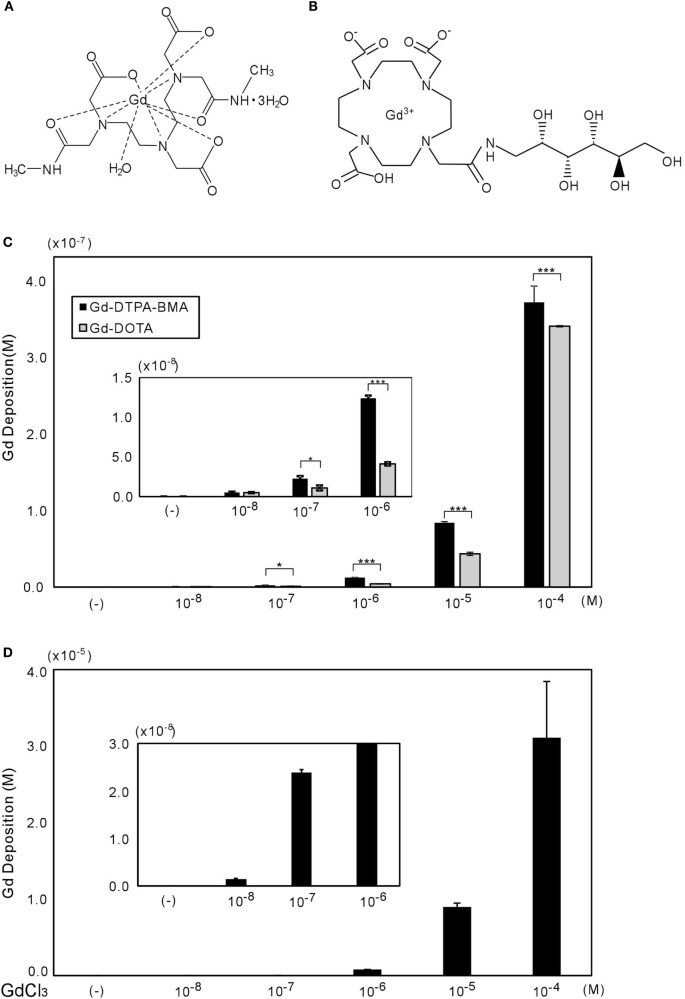
Chemical structures of Gd-DTPA-BMA (A) and Gd-DOTA (B), with gadolinium deposition shown in CV-1 cells (C,D). (A,B) molecular structures of Gd-DTPA-BMA and Gd-DOTA, respectively (28). The CV-1 cells were exposed to 10−8 to 10−4M of Gd-DTPA-BMA, Gd-DOTA, or GdCl3 for 24 h. The deposition of total gadolinium was determined by ICP-MS. Cellular Gd deposition (M/well) can be observed after Gd-DTPA-BMA and Gd-DOTA (C), and GdCl3 treatment (D). Note that the gadolinium concentration after GdCl3 treatment was approximately 100 times higher than that after GBCA treatments. Data are presented as means ± SEM of experiments performed in triplicate. ***p < 0.001 and *p < 0.05 indicate statistical significance by Bonferroni’s test.

