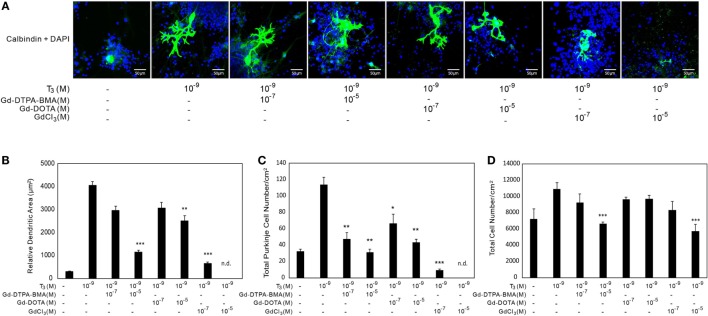
Figure 5.
Effects of GBCA or GdCl3 on the T3-induced arborization of Purkinje cell dendrites and the relative number of Purkinje cells. Cerebellar cells were cultured for 17 days followed by immunocytochemical analysis with calbindin and DAPI. (A) Representative photomicrographs showing the effects of Gd-DTPA-BMA, Gd-DOTA, or GdCl3 on Purkinje cell morphology. Bars indicate 50 μm. (B) Change in the dendritic areas of Purkinje cells following Gd-DTPA-BMA, Gd-DOTA, or GdCl3 treatment. (C) Change in the number of Purkinje cells/well (1 cm2) following Gd-DTPA-BMA, Gd-DOTA, or GdCl3 treatment. (D) Total number of DAPI-positive nuclei/well (1 cm2) following Gd-DTPA-BMA, Gd-DOTA, or GdCl3 treatment. Dendritic areas and total number of DAPI-positive nuclei were quantified using ImageJ software (NIH), and the total number of Purkinje and total cells/well was manually counted. Data are expressed as means ± SEM (n = 15 determinations) and are representative of at least three independent experiments. ***p < 0.001, **p < 0.01, and *p < 0.05 indicate statistical significance by Bonferroni’s test compared with T4 (+), and Gd-DTPA-BMA, Gd-DOTA, or GdCl3 (−).

