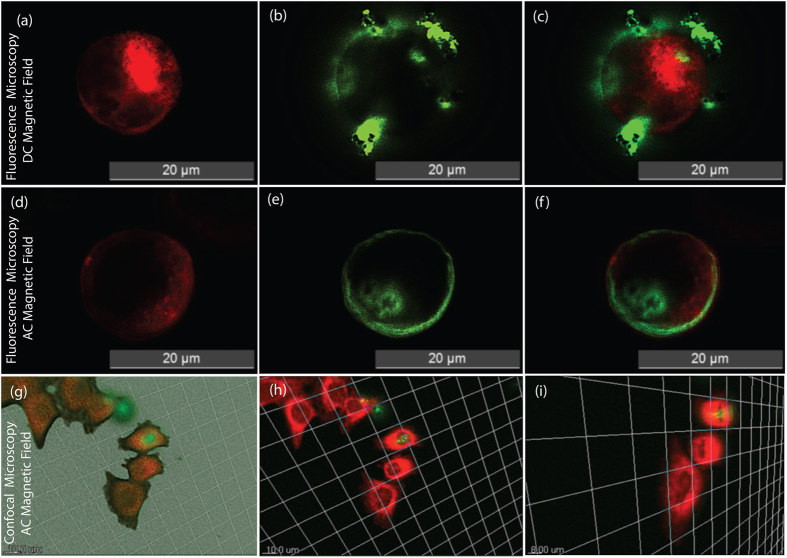
Figure 10. Fluorescence microscope images and confocal microscope z-stack images.
Fluorescence microscope image of HEP2 cells interaction with CSMENs when exposed to a d.c. magnetic field and point of view imaged in, (a) fluorescent microscope red filter mode; (b) fluorescent microscope green filter mode; (c) Fig. 10(a,b) merged together. FITC loaded nanoparticles can be seen outside the HEP2 cells; (d) Fluorescence microscope image of HEP2 cells interaction with CSMENs when exposed to an a.c. magnetic field and point of view imaged in, (e) fluorescent microscope red filter mode; (f) Particles penetrated into the HEP2 cell and scatters the green fluorescence with cell membrane as a scattering boundary and can be observed in fluorescent microscope green filter mode; (f) Fig. 10(d,e) merged together. FITC loaded nanoparticles can be seen penetrated inside the HEP2 cells; (g,h) Confirmation of CSMEN penetration into HEP2 cells under influence of an a.c. magnetic field using confocal microscope z-stack images. The scale bar is 10 μm; and (i) Zoomed and inclined view confirmation of CSMEN penetration into HEP2 cells using confocal microscope z-stack images with scale bar as 8 μm.

