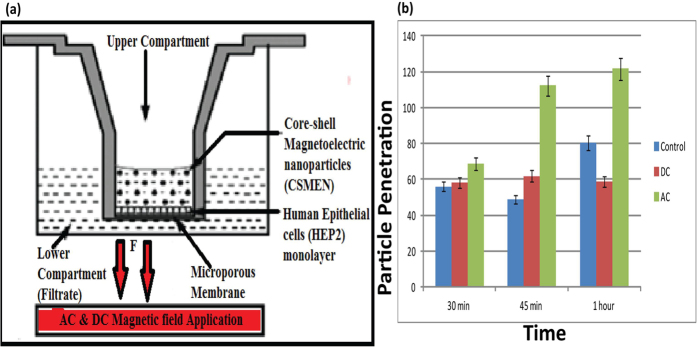
Figure 9. Schematic and results of the Transwell measurement.
(a) Diagram of Transwell experiment; (b) Transwell graph shows increased filtrate intensity over time in presence of an a.c. Magnetic field whereas the fluorescence intensity of filtrate in case of a d.c. magnetic field and control remains minimal.

