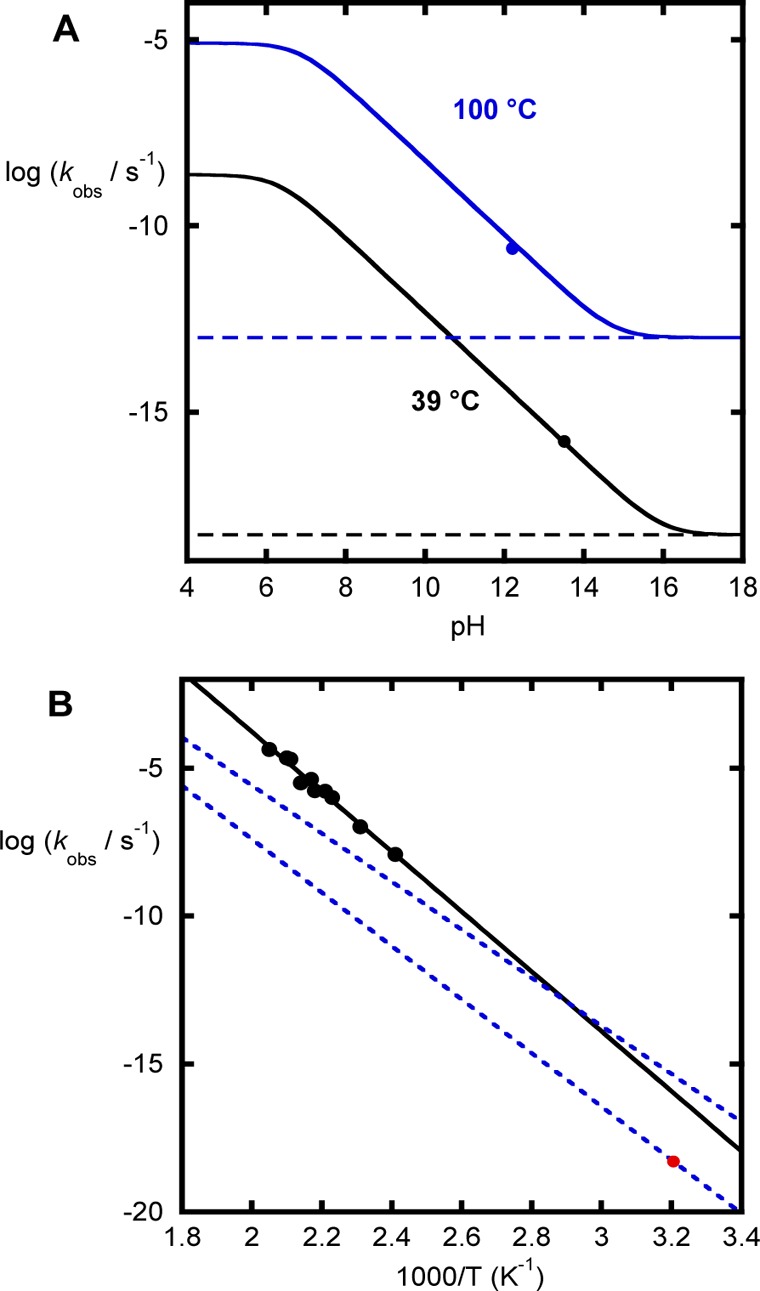
Figure 6.

(A) pH dependence of methyl phosphate hydrolysis. The black line (39 °C) was obtained by using the data reported for the hydrolysis of the monoanion at 100 °C and the reported activation parameters and a value of 6.3 for the second pKa of methyl phosphate. The blue line was obtained from the data reported for the hydrolysis of the monoanion at 100 °C, and the circle is the datum extrapolated from high temperature in 1 M KOH. (B) Temperature dependence of methyl phosphate hydrolysis. The black circles and line are the experimental data reported for methyl phosphate in 1 M KOH. The red point is the predicted rate constant for the solvent-assisted mechanism according to the Brønsted plot at 39 °C. The blue dashed lines illustrate the predictions for a potential substrate-assisted mechanisms with the entropy of activation fixed at −12 eu. For the corresponding temperature dependence, see Figure S1.
