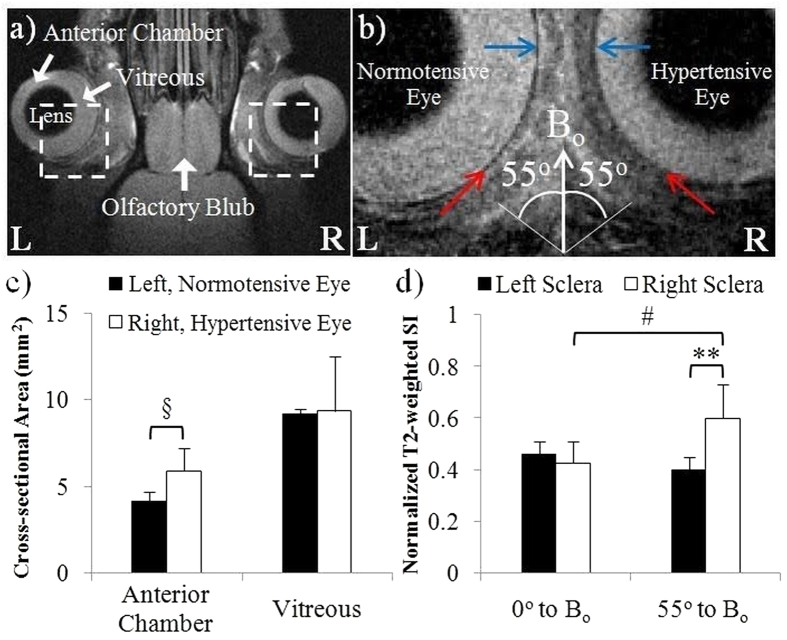
Figure 2. In vivo imaging of the effects of chronic IOP elevation on the rat scleral tissues.
(a) Representative in vivo T2-weighted MRI (T2WI) of the hypertensive right eye and normotensive left eye of adult Long Evans rats at 1.5 weeks after intracameral hydrogel injection to the right eye. (b) Enlarged view of the rat eyes from the broken-line boxes in (a). Blue and red arrows in both eyes indicated the sclera tissues oriented at 0° to the main magnetic field (Bo) and near the magic angle at 55° to Bo respectively. (c) Quantitative comparisons (mean ± standard deviation) of the cross-sectional areas of the anterior chamber and vitreous between the hydrogel-injected right eye and the uninjected left eye. (d) T2-weighted signal intensities (SI) in the sclera tissues oriented at about 0° or 55° (the magic angle) to Bo in both eyes. (Sidak’s multiple comparisons tests between left and right eyes: §p < 0.05; **p < 0.01; Tukey’s multiple comparisons tests between 0° to Bo and 55° to Bo on the same eye: #p < 0.05).

