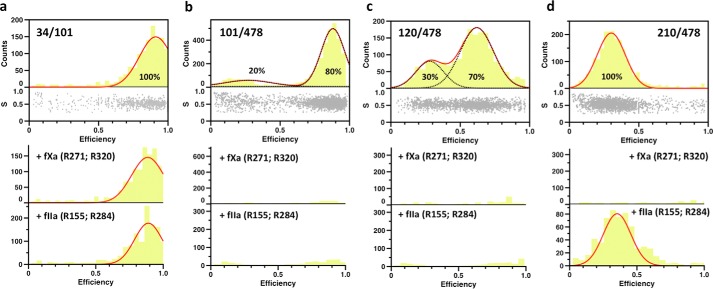
FIGURE 3.
smFRET measurements of prothrombin in solution. Shown are histograms of the four FRET couples probing the conformation of prothrombin in solution. The bottom section of the top graph of each construct depicts the stoichiometry, S, versus FRET efficiency for each diffusing molecule that contains both AF555 and AF647 fluorophores. The upper section shows the one-dimensional efficiency histogram of the molecules in the bottom section. Populations were fit to a single (34/101 and 210/478 FRET couples) or double (101/478 and 120/478 FRET couples) Gaussian distribution (red lines). The percentage of each population is indicated. The bottom graphs depict the results of incubation with factor Xa (fXa) or thrombin (fIIa) for 3 h at room temperature. a–d, proteolytic digestion by factor Xa or thrombin minimally affects the 34/101 couple (a), but abrogates the FRET signal for the 101/478 and 120/478 couples (b and c), as expected. The FRET signal for the 210/478 couple (d) disappears upon digestion with factor Xa due to cleavage at Arg271. Cleavage at Arg320 by factor Xa does not separate the A and B chains that remain connected through the disulfide bond between Cys293 and Cys439. Cleavage at Arg284 by thrombin drastically reduces the signal, as evidenced by the lower counts, but it is not as efficient as the one at R155.

