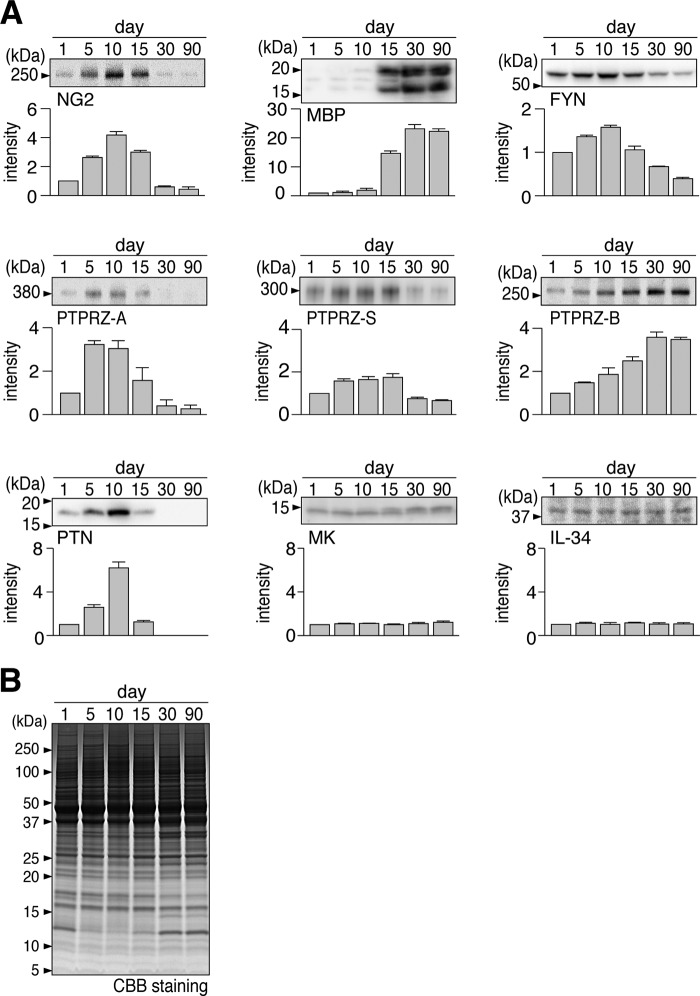
FIGURE 3.
Developmental expression profiles of PTPRZ and related molecules in the mouse brain. A, Western blotting to analyze the expression patterns of oligodendrocyte-lineage cell markers (NG2 and MBP), FYN kinase, PTPRZ isoforms (PTPRZ-A, PTPRZ-S, and PTPRZ-B), and PTPRZ ligands (PTN, MK, and IL-34) in the whole mouse brain at P1, P5, P10, P15, P30, and P90, respectively. In analyses of NG2 and PTPRZ, brain extracts were treated with chABC before SDS-PAGE; no obvious bands of PTPRZ-A, -B, or -S were detected without the chABC treatment, as described previously (19). The graph below each blot shows the arbitrary densitometric units of the detected signal intensity normalized to the value at P1. Data are the mean ± S.E. (error bars) (n = 4 animals/group). B, Coomassie Brilliant Blue (CBB) staining was used to verify the applied protein amounts.

