FIGURE 3.
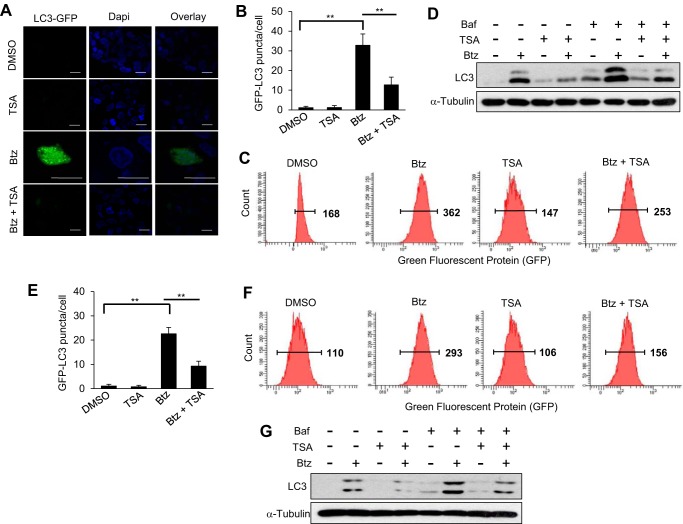
TSA inhibits Btz-induced autophagy activation in HNSCC cells. A, microscopic images of GFP-LC3 puncta in SCC1 cells treated with DMSO, TSA, and/or Btz for 24 h. Scale bar, 15 μm. B, bar graph represents average number of GFP-LC3 puncta/cell in SCC1 cells treated with DMSO, TSA, and/or Btz for 24 h. Values are means ± S.D.; **, p < 0.01. C, flow cytometry analysis of SCC1 cells infected with lentivirus expressing GFP-LC3. D, Western blotting of LC3 proteins in SCC1 cells treated with DMSO, Baf, TSA, and/or Btz for 16 h. E, bar graph represents average number of GFP-LC3 puncta/cell in SCC23 cells treated with DMSO, TSA, and/or Btz for 24 h. Values are means ± S.D.; **, p <0.01. F, flow cytometry analysis of SCC23 cells infected with lentivirus expressing GFP-LC3. Cells were treated with DMSO, Btz, and/or TSA for 24 h. G, Western blotting of LC3 proteins in SCC23 cells treated with DMSO, Baf, TSA, and/or Btz for 24 h. Baf was added 3 h prior to the cell harvest.

