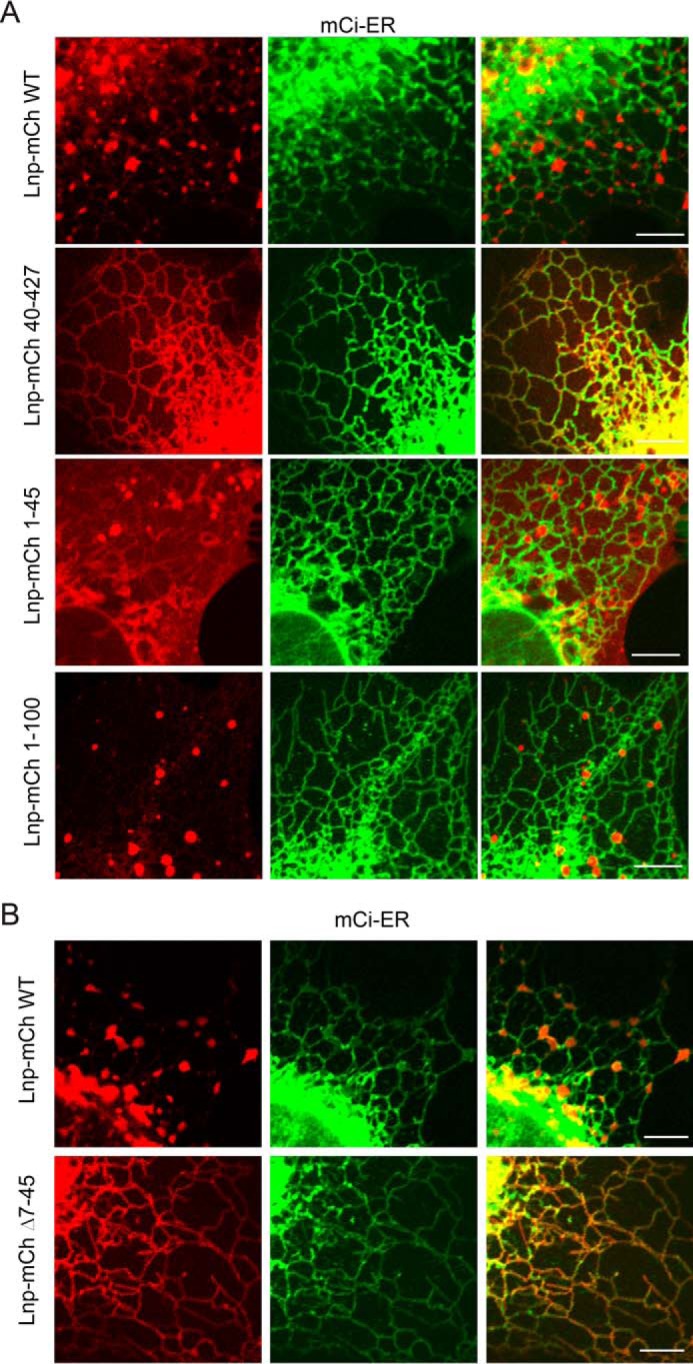
FIGURE 6.

Live cell imaging analysis of mCherry-tagged Lnp subcellular localization. A, the indicated Lnp variants fused with mCherry were transiently expressed together with mCitrine (mCi)-ER in COS7 cells. 24 h post-transfection, cells were directly imaged by a confocal microscope. Scale bars, 2 μm. B, as in A, except that the indicated Lnp variants were analyzed. Scale bars, 2 μm.
