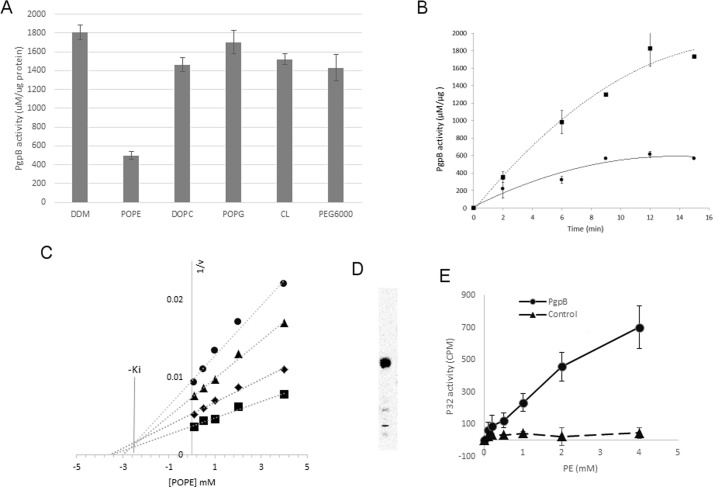
FIGURE 2.
In vitro inhibition of PgpB by PE. A, 2 μg of PgpB protein was premixed with 3 mm POPE, DOPC, POPG, or CL, 0.5% DDM, or 10% PEG 6000 for 10 min at room temperature before adding 18:1 LPA for 30 min. The remaining PgpB activity was monitored using a colorimetric phosphatase assay. B, a time course of LPA reaction of PgpB (squares) or in the presence of 3 mm POPE (circles). C, Dixon plot of reciprocal rates of phosphate release (1/v) as a function of POPE concentration. Each line represents linear regression analysis of the reciprocal of average simulated rates for different substrate concentrations as a function of inhibitor concentration. Substrate concentrations: 10 μm (circles), 50 μm (triangles), 100 μm (diamonds), 250 μm (squares). −Ki value of inhibition was estimated based on the intersection of linear regression. D, TLC analysis of 32P-labeled total lipids from E. coli UE54 strain, visualized by a phosphorimaging system. E, [32P]PE pulldown assay using the PgpB protein (circles) on a Ni-NTA resin as a function of POPE concentration. Empty resin (triangles) was used as control. The bound PE ligand was quantified by a scintillation counter.

