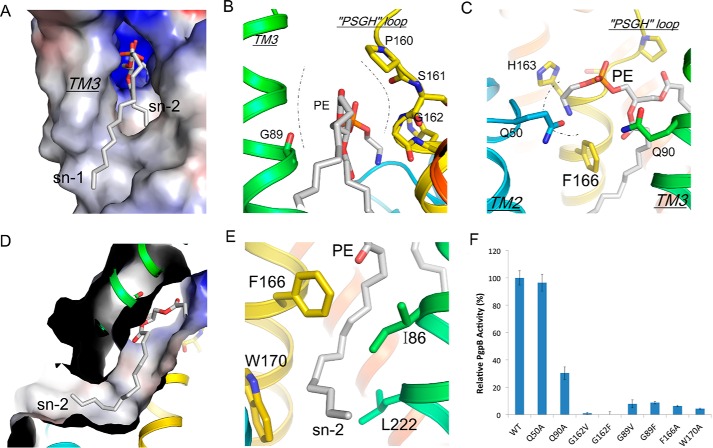
FIGURE 5.
PE conformation in the TM3 tunnel. A, electrostatic surface representation of the TM3 tunnel with PE (sticks). B, TM3 tunnel is constructed by TM3 (green) and PSGH sequence (yellow). The tunnel neck is drawn as dashed lines. C, the headgroup conformation of bound PE in the front of the catalytic site. D, a cut-through view of the electrostatic surface shows the Sn2 tail of PE inside the acyl chain pore. E, the conformation of the pore-lining residues stabilizes the PE Sn2 tail (gray). F, characterization of PgpB mutations in the TM3 tunnel or the front V-shaped cavity using 18:1 LPA as substrate. All activities were normalized to that of wild type.

