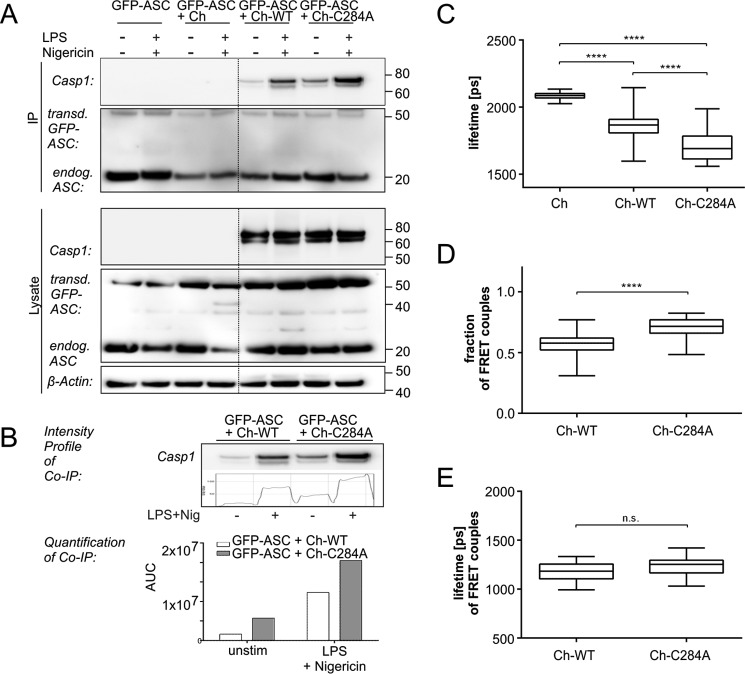
FIGURE 3.
Increased numbers of enzymatically inactive variant p.C284A caspase-1 molecules interact with ASC within pyroptosomes. A, for co-immunoprecipitation (IP), iBMDMcasp1/11-ko cells expressing GFP-ASC together with either Ch-WT or Ch-C284A were primed with LPS and then stimulated with nigericin as indicated. Cells were lysed and incubated with anti-ASC-coupled resins, followed by SDS-PAGE and Western blotting detection. More Ch-C284A molecules were co-immunoprecipitated with ASC in transduced iBMDMcasp1/11-ko cells after NLRP3-stimulation (first lane) compared with Ch-WT molecules. B, densitometric analysis of co-immunoprecipitated proteins showed quantitatively the enhanced interaction between Ch-C284A molecules and ASC compared with Ch-WT molecules. unstim, unstimulated. C–E, iBMDMcasp1/11-ko cells expressed GFP-ASC (donor) together with either Ch-WT or Ch-C284A (acceptor). mCherry served as a negative control. Caspase-1 activation was induced by 4 h of priming with 1 μg/ml LPS, followed by 10 μm nigericin. After 5 h, cells were fixed, and cells expressing both GFP-ASC and mCherry-caspase-1 (or mCherry alone) were analyzed by FLIM-FRET. C, first, data were fitted to single-exponential decay. Here a low lifetime indicated a short distance between donor and acceptor, hence, in our case, an overall close interaction. D and E, a double-exponential decay model allowed us to distinguish between interacting and non-interacting components contributing to the overall decay function. The fraction of FRET couples represents the amount of interacting donor-acceptor pairs. For example, a fraction of 1.0 would imply that every single GFP-ASC molecule found an mCherry-caspase-1 molecule with which to interact (D). The lifetime of FRET couples refers to the distance and interaction strength of each interacting pair of molecules. The box plots indicate median results of at least 22 analyzed specks from three independent experiments (E). Statistical significance was determined by one-way analysis of variance followed by Tukey's multiple comparisons test. ****, p < 0.0001; n.s., not significant. Standard errors of the mean are indicated. AUC, area under the curve.

