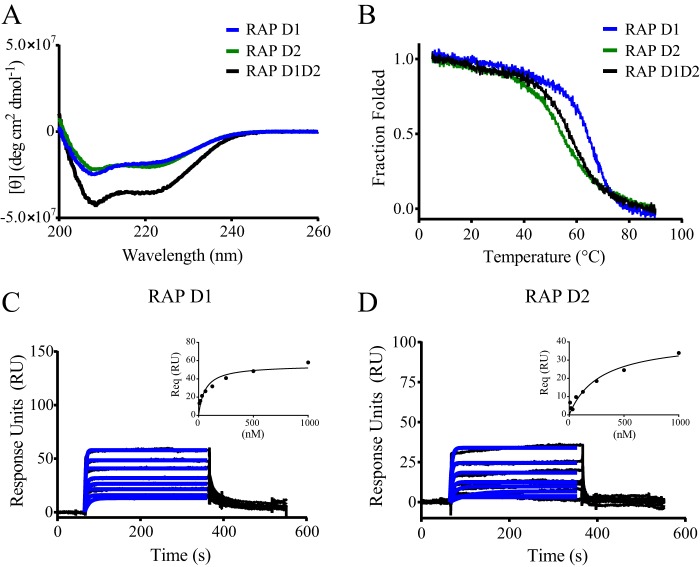
FIGURE 1.
RAP D1 and D2 domains bind weakly to LRP1. A, CD spectroscopy was used to measure changes in molar ellipticity as an indication of helical content in RAP D1D2 (black), RAP D1 (blue), and RAP D2 (green). B, CD spectroscopy was used to measure the thermally induced denaturation of RAP D1D2 (black), RAP D1 (blue), and RAP D2 (green) at 222 nm. Surface plasmon resonance measurements of RAP D1 (C) and RAP D2 (D) (each at 8, 16, 31, 63, 125, 250, 500, and 1000 nm) binding to LRP1 are shown. Req values were determined by fitting the data to a pseudo-first order process (blue lines). Response units at equilibrium were plotted against RAP domain concentration (insets) to determine equilibrium binding constants by fitting the data to a single class of sites using non-linear regression analysis.

