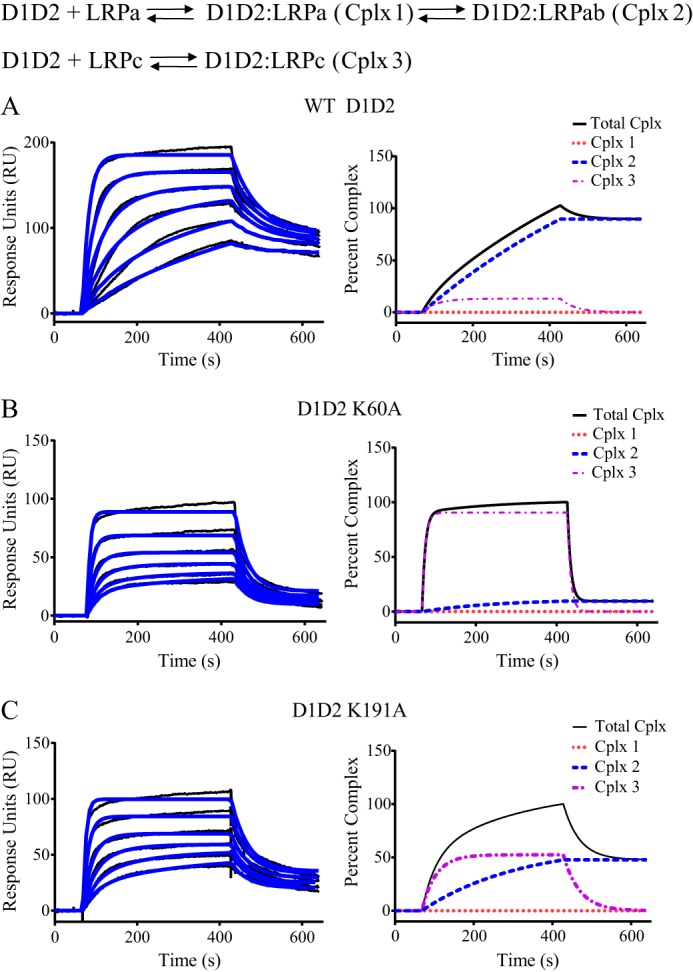
FIGURE 7.

Mutagenesis of lysine 60 and lysine 191 in RAP D1D2 impacts the mode of binding to LRP1. Surface plasmon resonance measurements of WT RAP D1D2 (A), RAP D1D2 K60A (B), and RAP D1D2 K191A (C) (1.6, 2.1, 6.3, 12.5, 25, and 50 nm) binding to LRP1. The data were fit to the model incorporating Schemes 1 and 2, and the fit curves are shown in blue. In the right panels, the percent of total complex (black), complex I (red dotted line), complex 2 (blue dashed line), and complex 3 (purple dashed line) are shown as a function of time from the fit data obtained at 1.6 nm D1D2.
