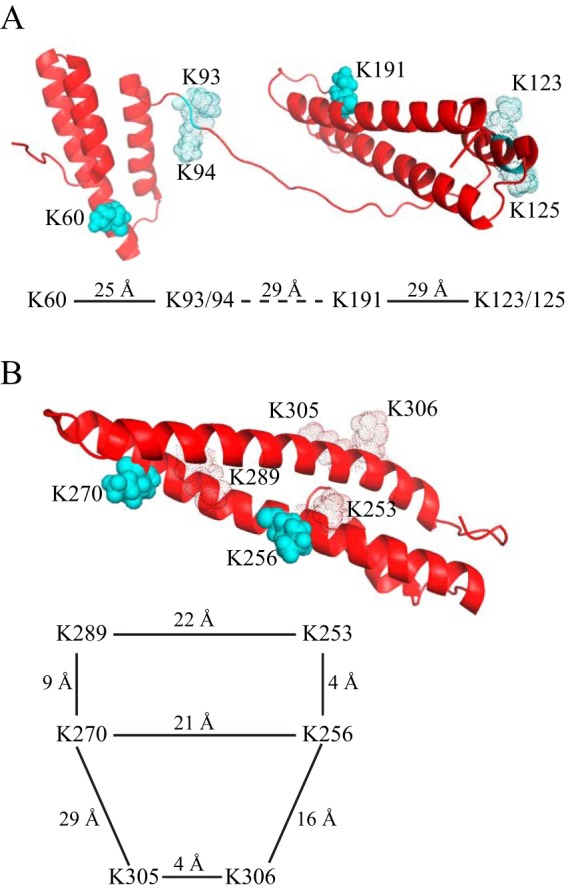
FIGURE 8.

Structure of RAP D1D2 (A) and D3 (B) showing key lysine residues interacting with LRP1. The ribbon diagram shows the critical lysine residues 60 and 191 in D1D2 and critical lysine residues 253 and 270 in D3 as solid cyan spheres. Additional lysine residues that contribute to binding are shown in silhouette. The distances between these residues are diagrammed. Figures are from Protein Data Bank structure 2P03.
