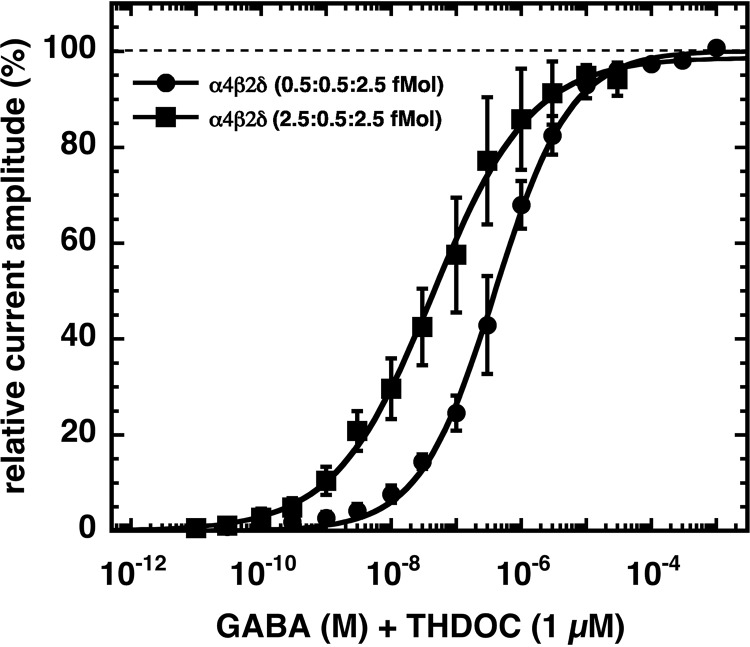
FIGURE 3.
GABA concentration dependence of non-concatenated α4β2δ receptors expressed at different subunit ratios. Oocytes were injected with x fmol of cRNA coding for α4, 0.5 fmol of β2, and 2.5 fmol of δ, where x was either 0.5 or 2.5. GABA concentration-response curves of these receptors were recorded in the presence of 1 μm THDOC. Individual curves were first normalized to the fitted maximal current amplitude and subsequently averaged. Concentration-response curves obtained from both receptors were fitted with a single phase. Data are expressed as mean ± S.D. (n = 3).

