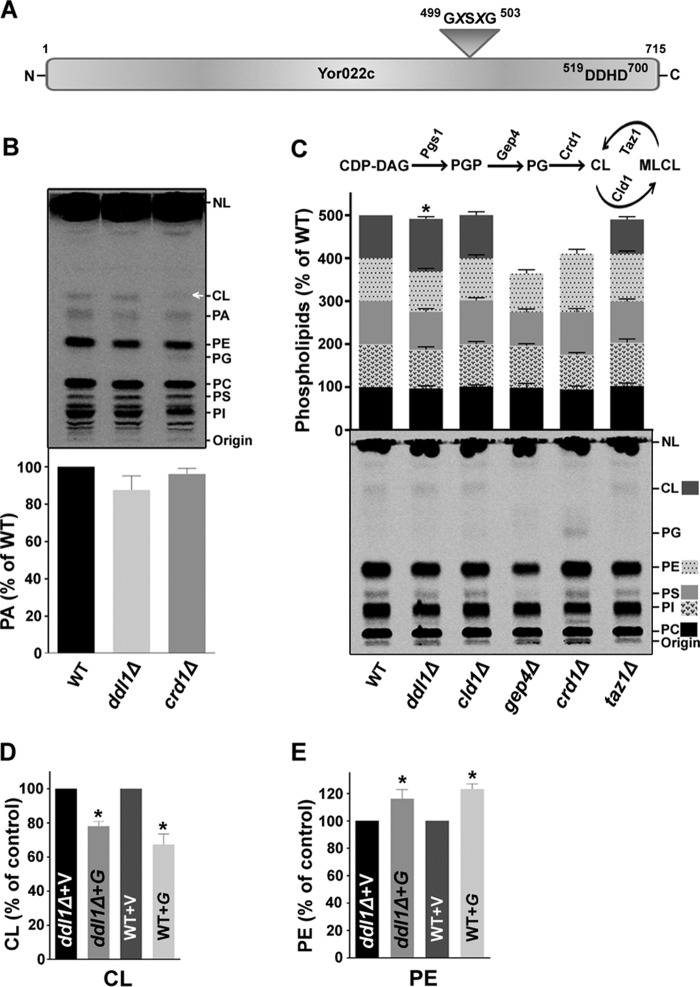
FIGURE 1.
Effect of the DDL1 gene on the cellular phospholipid content. A, schematic diagram representing the two conserved regions: the lipase motif and DDHD domain in the Ddl1 (Yor022c) protein. B and C, effect of deletion of the DDL1 gene on phospholipids content. In B, an unidentified lipid species also migrated at the position of CL in the crd1Δ strain (indicated by an arrow). NL, nonpolar lipids. In C, a schematic diagram represents the key enzymes of CL metabolism (upper panel), and the extracted lipids were analyzed on a TLC plate (bottom panel). D and E, DDL1 overexpression and cellular CL and PE levels. V, pYES2/NT B vector; G, pYES2/NT B-DDL1. In each TLC analysis, the lipids that were extracted from the stationary-phase cells (A600 = 25) grown in the presence of [14C]acetate were analyzed on a TLC plate followed by phosphorimaging, and the label was counted with a liquid scintillation counter. To show each phospholipid, the optimum brightness and contrast were adjusted in the images. The values are presented as the mean ± S.E. (n = 3). Significance was determined at *, p < 0.05.

