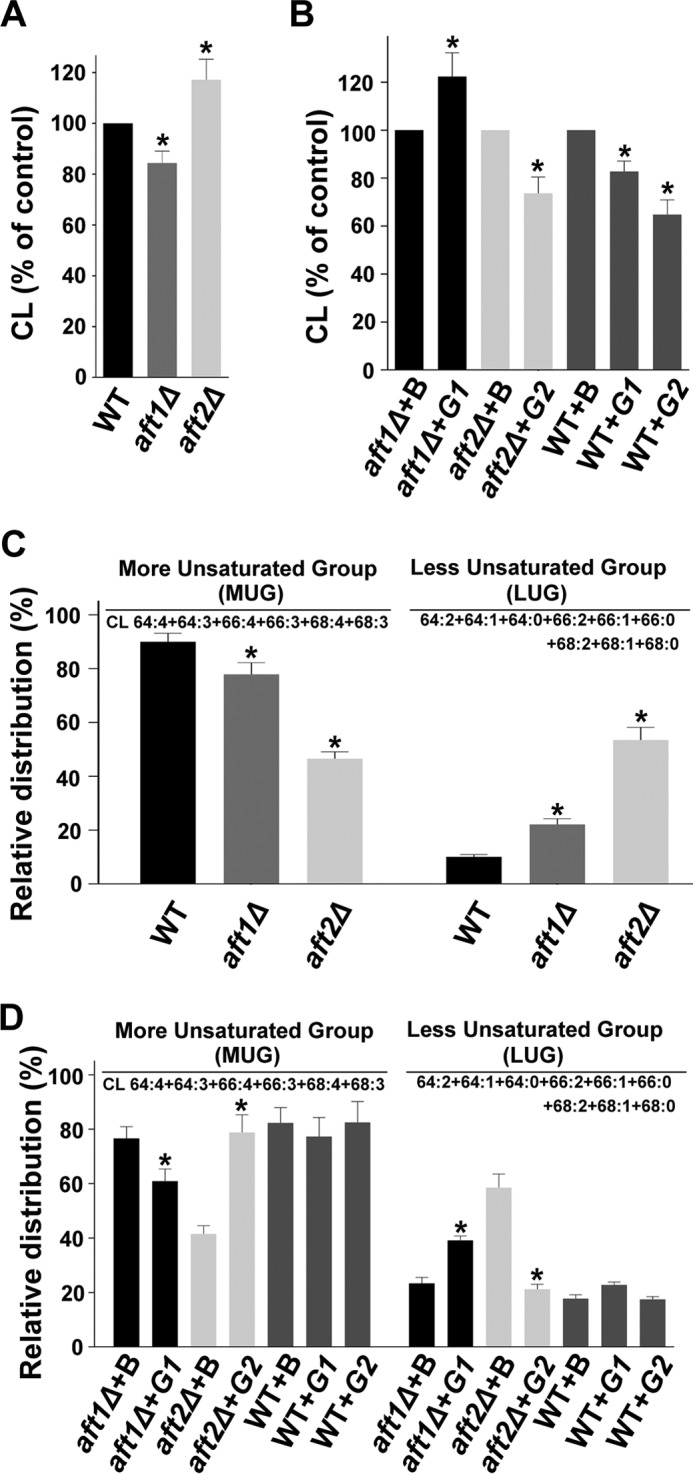
FIGURE 10.

The AFT1 and AFT2 genes and cellular CL content. A and B, effects of the AFT1 and AFT2 genes on the cellular CL content. The lipids that were extracted from the stationary-phase cells (A600 = 25) grown in the presence of [14C]acetate were resolved on a TLC plate. C, effect of deletion of the AFT1 and AFT2 genes on molecular species of CL. The extracted lipids were analyzed by MS/MSALL. In C, the values in the WT panel were duplicated from Fig. 4A to generate the graph. D, effects of the AFT1 and AFT2 genes on molecular species of CL. The extracted lipids were analyzed by MS/MSALL (B, BG1805 vector; G1, BG1805-AFT1; and G2, BG1805-AFT2). The values are presented as the mean ± S.E. (n = 3). Significance was determined at *, p < 0.05.
