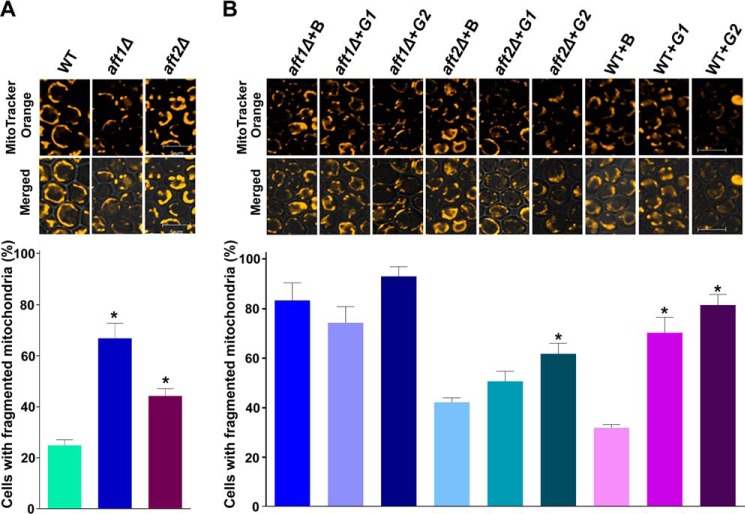
FIGURE 11.
Physiological significance of the AFT1 and AFT2 genes. A and B, effects of AFT1 and AFT2 deletion (A) and overexpression (B) on mitochondrial morphology. Stationary-phase cells were stained with mitochondrial dye. The images were captured with a confocal microscope B, BG1805 vector; G1, BG1805-AFT1; G2, BG1805-AFT2. In A, the values in the WT panel were duplicated from Fig. 8A. Bar, 5 μm. To quantify mitochondrial fragmentation, at least 200 cells were scored in each background. The values are presented as the mean ± S.E. (n = 3). Significance was determined at *, p < 0.05.

