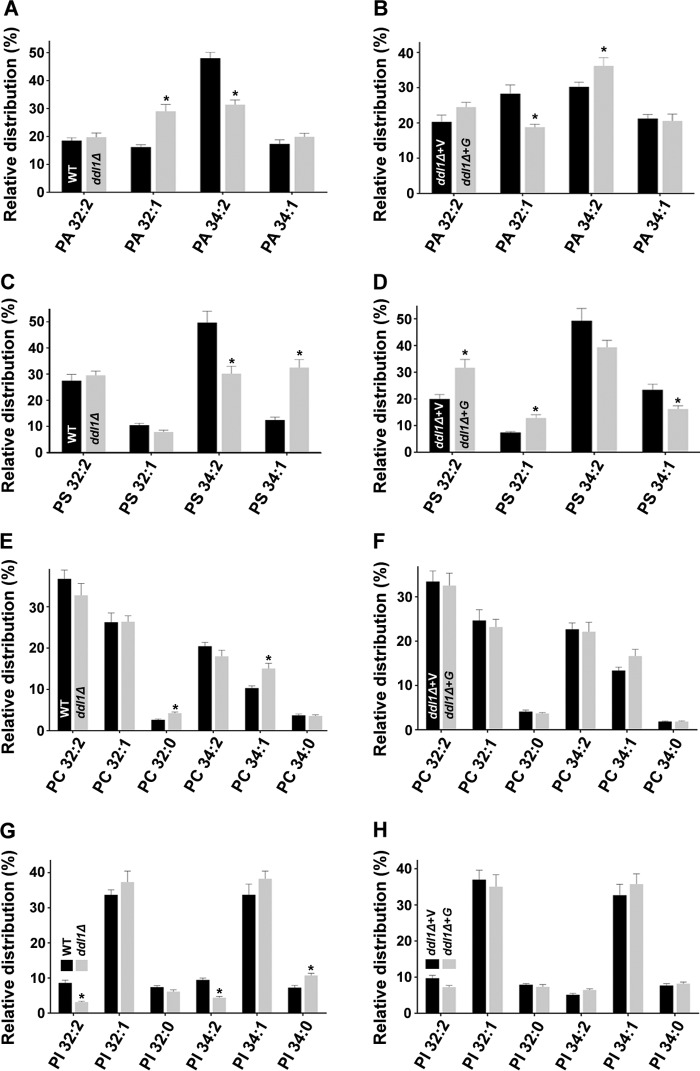
FIGURE 5.
Effect of the DDL1 gene on the molecular species of the different phospholipids. A–H, effect of the DDL1 gene on the molecular species of the different phospholipids: PA (A and B), PS (C and D), PC (E and F), and PI (G and H). In each case, the extracted lipids were analyzed by MS/MSALL. For the relative quantification of the phospholipids, the amount of each molecular species was determined relative to the total species present in both clusters (C32 and C34). V, pYES2/NT B vector; G, pYES2/NT B-DDL1. The values are presented as the mean ± S.E. (n = 3). Significance was determined at *, p < 0.05.

