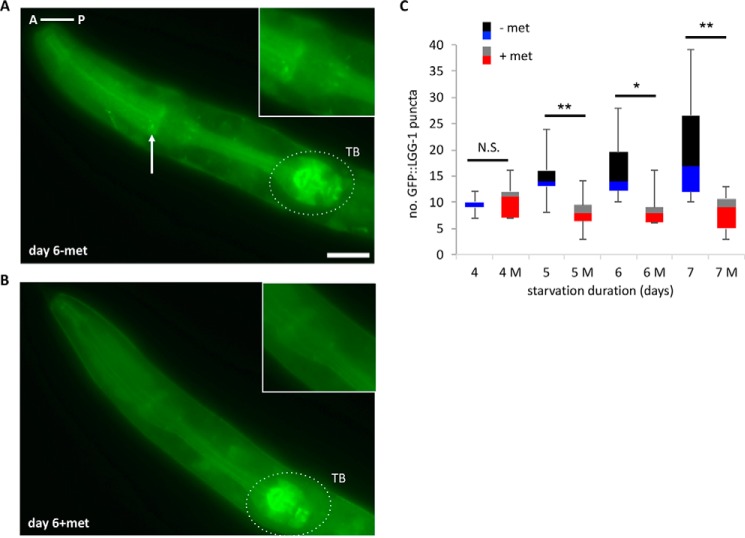
FIGURE 3.
Metformin reduces L1 longevity and dysregulates autophagy. A and B, 6 days of L1 starvation increases GFP-LGG-1 puncta in the head (A), but metformin (met) treatment reduces puncta formation after 6 days of starvation (B). An arrow indicates a punctum. Scale bar = 10 μm. A is anterior (left), and P is posterior (right) of the animal. TB, terminal bulb. C, quantification of the puncta after each day of starvation (for the x axis, 4, 5, 6, 7: starvation days without metformin, 4 M, 5 M, 6 M, 7 M: starvation days with metformin (100 mm)). The box plot represents the median (the line between two boxes) and interquartile ranges (the bottom box is for the 25th to 50th percentile, and the upper box is for the 50th to 75th percentile). Whiskers (T-shaped projection) represent the minimum and the maximum values. N.S., not significant, *, p < 0.05, **, p < 0.01, by Student's t test.

