
Fig. 3.
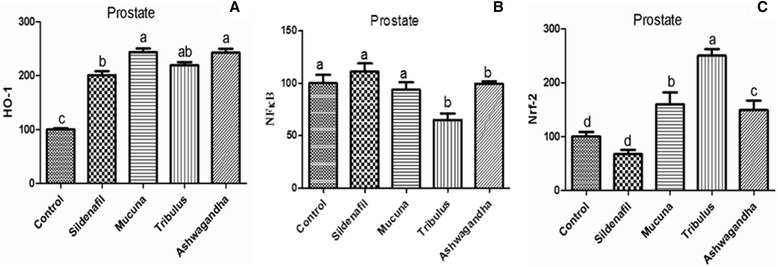
HO-1 (a), NF-κB (b) and Nrf-2 (c) Protein levels of prostate tissue in male rats (P < 0.0001). Data are expressed as a ratio of normal control value (set to 100 %). Blots were repeated at least 4 times (n = 4) and a representative blot is shown. Actin was included to ensure equal protein loading. The bars represent the standard error of the mean. Data points with different superscripts are significantly