
Fig. 5.
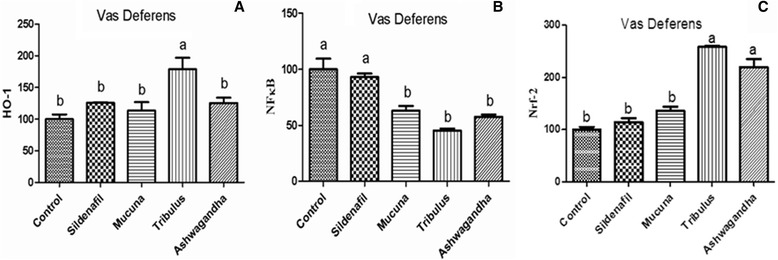
HO-1 (a), NF-κB (b) and Nrf-2 (c) Protein levels of vas deferens tissue in male rats (P < 0.0001). Data are expressed as a ratio of normal control value (set to 100 %). Blots were repeated at least 4 times (n = 4) and a representative blot is shown. Actin was included to ensure equal protein loading. The bars represent the standard error of the mean. Data points with different superscripts are significantly different at the level of P < 0.05 by Fisher’s multiple comparison test