
Fig. 5.
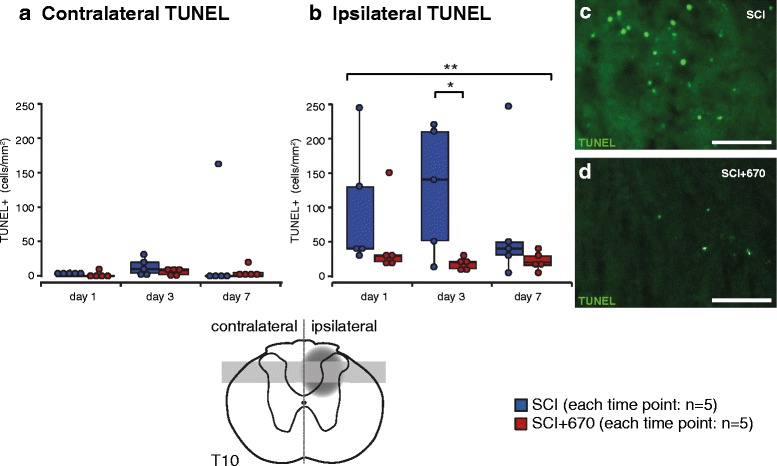
Cell death is reduced by red light following T10 hemicontusion spinal cord injury. Quantification of cells undergoing cell death (TUNEL+) contralateral (a) and ipsilateral (b) to the injury. Example images are from SCI (c) and SCI+670 (d) dorsal horn ipsilateral to the injury at 3 days post-injury. Schematic cross section of spinal cord (bottom) indicates location of injury (dark grey penumbra) and region of quantification (light grey region). Scale bars: 50 μm. *p < 0.05 (Student’s t test); **p < 0.01 (linear mixed model)