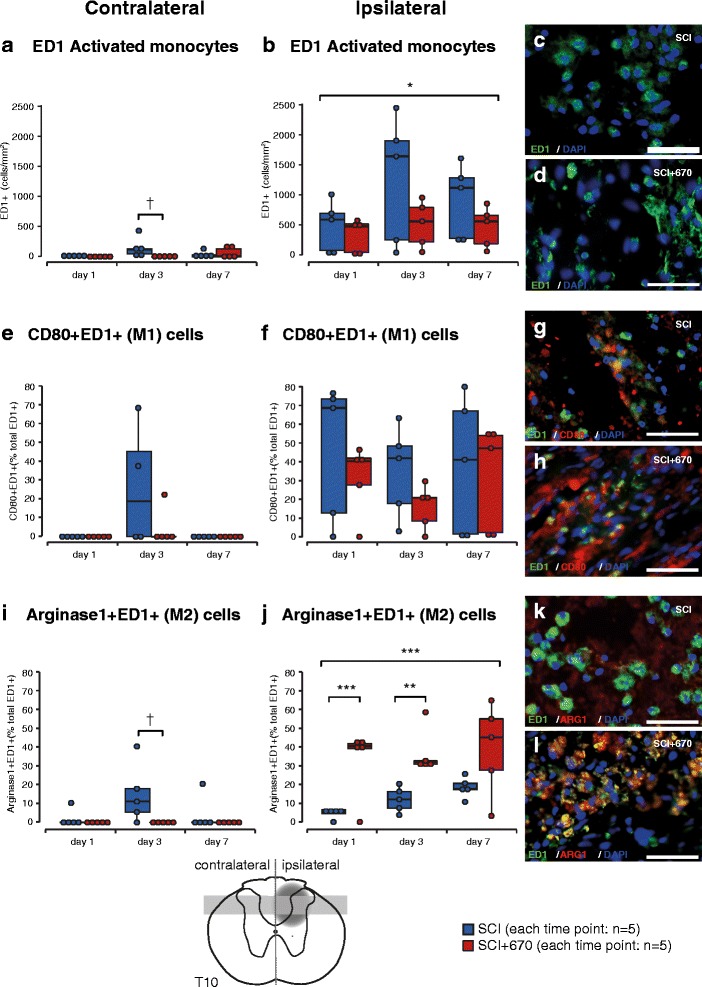
Fig. 6.

Anti-inflammatory microglia/macrophages are promoted early by red light treatment following T10 hemicontusion spinal cord injury. a–d Total activated microglia/macrophages (ED1+) per mm2 contralateral (a) and ipsilateral (b) to the injury and example images from SCI (c) and SCI+670 (d) groups. e–h M1 (pro-inflammatory) microglia/macrophages (CD80+ED1+ double labelled) expressed as a proportion of total ED1+ cells contralateral (e) and ipsilateral (f) to the injury and example images from SCI (g) and SCI+670 (h) groups. i–l: M2 (anti-inflammatory) microglia/macrophages (Arginase1+ED1+ double labelled) expressed as a proportion of total ED1+ cells contralateral (i) and ipsilateral (j) to the injury and example images from SCI (k) and SCI+670 (l) groups. All example images are taken from the injury zone of the dorsal horn at 7 days post-injury. Schematic cross section of spinal cord (bottom) indicates location of injury (dark grey penumbra) and region of quantification (light grey region). Scale bars: 50 μm. *p < 0.05 (linear mixed model); **p < 0.01, ***p < 0.001 (Student’s t test); † p < 0.05, †† p < 0.01, ††† p < 0.001 (Wilcoxon rank-sum)
