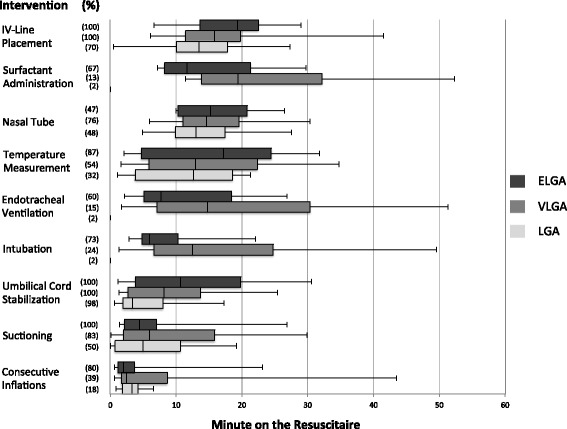
Fig. 2.

Time to first use of intervention II. Shown are how often the rest of the interventions were given (n in parenthesis - % of all of the groups). For each intervention the time point of first occurrence is given as median (horizontal line in the middle of each box), 25th and 75th percentiles (top and bottom of each box) and minimum/maximum (whiskers mark) of all analyzed recordings
