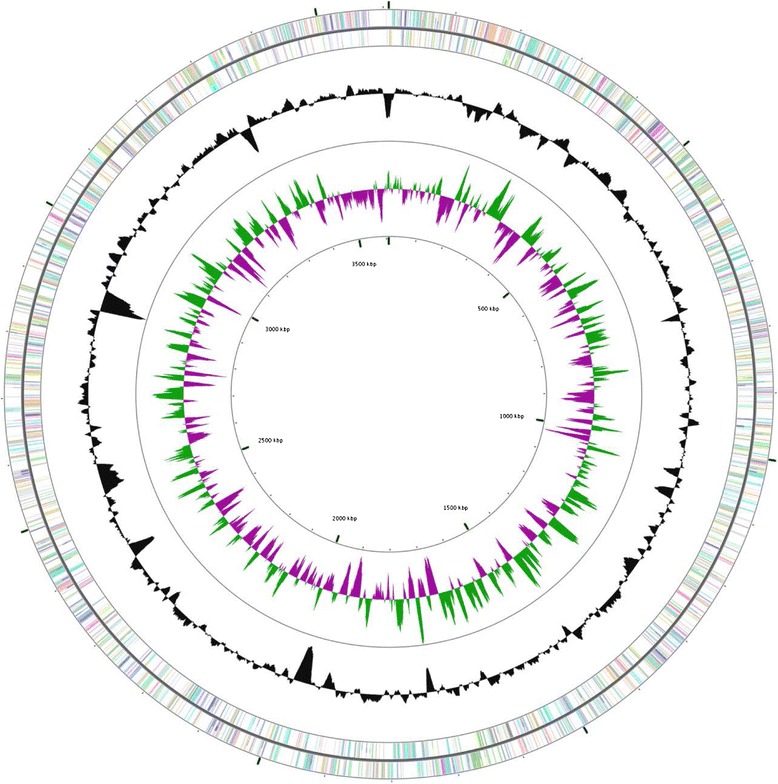
Fig. 6.

Graphical map of genome of Arthrobacter agilis strain L77. From outside to centre: RNA genes (Brown, tRNA and light purple, rRNA) and other genes are colored according to COG categories. Inner circle shows the GC skew with positive (+) as dark green and negative (−) as dark purple. GC content is indicated in black
