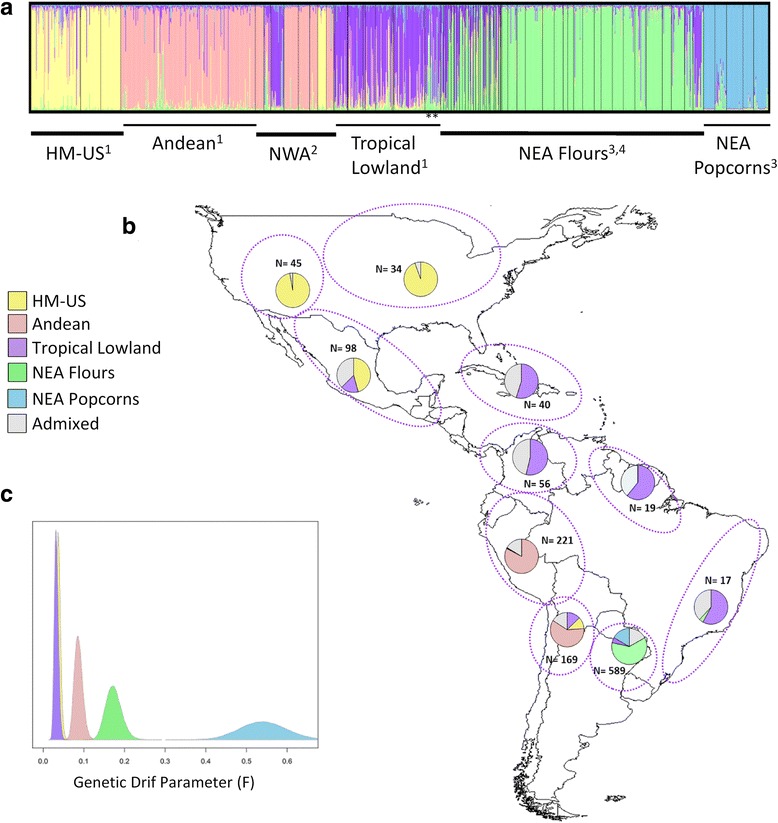
Fig. 1.

Estimated population structure of maize landraces from the Americas. a STRUCTURE bar plots for K = 5. Each vertical line represents an individual and colours represent their inferred ancestry from K ancestral populations. Individuals are ordered by sampling region and source study. b Geographical distribution of the clusters inferred by STRUCTURE. Dotted lines indicate the geographic extent considered for each chart. c Posterior densities of the genetic drift parameter (F) from STRUCTURE correlated allele frequency model. 1 Data from Vigouroux et al. [8]; 2 data from Lia et al. [15]; 3 data from Bracco et al. [14]; 4 data from this study. * Brazilian accessions. HM-US: Highland Mexico and US; NWA: North Western Argentina; NEA: North Eastern Argentina
