Fig. 3.

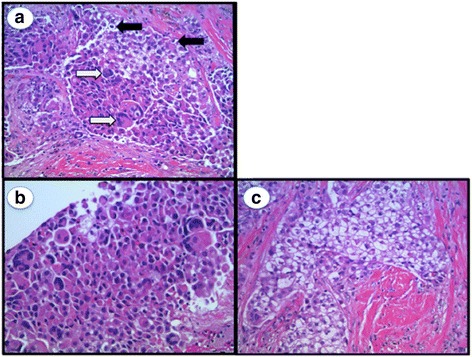
H&E stain demonstrating invasive ductal carcinoma. a Both OLGCs (white arrows) and clear cells (black arrows) are present throughout the tumor. b Large focus of OLGCs. c Predominant clear cell features

H&E stain demonstrating invasive ductal carcinoma. a Both OLGCs (white arrows) and clear cells (black arrows) are present throughout the tumor. b Large focus of OLGCs. c Predominant clear cell features